Prometheus has revolutionized the way we monitor and alert on modern infrastructure. As an open-source monitoring toolkit originally built at SoundCloud, Prometheus provides powerful time-series data collection, storage, and querying capabilities that make it the go-to solution for Linux system monitoring.
What is Prometheus?
Prometheus is a multi-dimensional time-series database with a built-in alerting system. It scrapes metrics from configured targets at given intervals, evaluates rule expressions, displays results, and triggers alerts when specified conditions are met. Its pull-based architecture and service discovery capabilities make it particularly well-suited for dynamic cloud environments and containerized applications.
Key Features of Prometheus
- Multi-dimensional data model with time series identified by metric name and key/value pairs
- PromQL – A flexible query language for leveraging dimensionality
- No dependency on distributed storage – Single server nodes are autonomous
- HTTP pull model with support for pushing via intermediary gateway
- Service discovery or static configuration for target discovery
- Multiple modes of graphing and dashboarding support
Installing Prometheus on Linux
Method 1: Binary Installation
The most straightforward way to install Prometheus is using the pre-compiled binaries:
# Create prometheus user
sudo useradd --no-create-home --shell /bin/false prometheus

# Create directories
sudo mkdir /etc/prometheus
sudo mkdir /var/lib/prometheus

# Set ownership
sudo chown prometheus:prometheus /etc/prometheus
sudo chown prometheus:prometheus /var/lib/prometheus

# Download Prometheus
cd /tmp
wget https://github.com/prometheus/prometheus/releases/download/v2.45.0/prometheus-2.45.0.linux-amd64.tar.gz

# Extract
tar xvf prometheus-2.45.0.linux-amd64.tar.gz
cd prometheus-2.45.0.linux-amd64

# Copy binaries
sudo cp prometheus /usr/local/bin/
sudo cp promtool /usr/local/bin/

# Set ownership for binaries
sudo chown prometheus:prometheus /usr/local/bin/prometheus
sudo chown prometheus:prometheus /usr/local/bin/promtool

# Copy configuration files
sudo cp -r consoles /etc/prometheus
sudo cp -r console_libraries /etc/prometheus
sudo cp prometheus.yml /etc/prometheus/prometheus.yml

# Set ownership
sudo chown -R prometheus:prometheus /etc/prometheus
Method 2: Package Manager Installation
For Ubuntu/Debian systems:
# Update package list
sudo apt update

# Install Prometheus
sudo apt install prometheus

# For CentOS/RHEL/Fedora
sudo yum install prometheus
# or
sudo dnf install prometheus
Method 3: Docker Installation
Running Prometheus in a Docker container:
# Pull Prometheus image
docker pull prom/prometheus

# Run Prometheus container
docker run -d \
  --name prometheus \
  -p 9090:9090 \
  -v /path/to/prometheus.yml:/etc/prometheus/prometheus.yml \
  prom/prometheus
Basic Configuration
The main configuration file is prometheus.yml. Here’s a basic configuration example:
global:
  scrape_interval: 15s
  evaluation_interval: 15s

rule_files:
  - "first_rules.yml"
  - "second_rules.yml"

alerting:
  alertmanagers:
    - static_configs:
        - targets:
          - alertmanager:9093

scrape_configs:
  - job_name: 'prometheus'
    static_configs:
      - targets: ['localhost:9090']

  - job_name: 'node'
    static_configs:
      - targets: ['localhost:9100']
Configuration Parameters Explained
- scrape_interval: How frequently to scrape targets
- evaluation_interval: How often to evaluate rules
- rule_files: List of files containing recording and alerting rules
- scrape_configs: Configuration for what to scrape
Creating a Systemd Service
To run Prometheus as a system service, create a systemd unit file:
sudo nano /etc/systemd/system/prometheus.serviceAdd the following content:
[Unit]
Description=Prometheus
Wants=network-online.target
After=network-online.target

[Service]
User=prometheus
Group=prometheus
Type=simple
ExecStart=/usr/local/bin/prometheus \
    --config.file /etc/prometheus/prometheus.yml \
    --storage.tsdb.path /var/lib/prometheus/ \
    --web.console.templates=/etc/prometheus/consoles \
    --web.console.libraries=/etc/prometheus/console_libraries \
    --web.listen-address=0.0.0.0:9090 \
    --web.enable-lifecycle

[Install]
WantedBy=multi-user.target
Enable and start the service:
# Reload systemd
sudo systemctl daemon-reload

# Enable Prometheus service
sudo systemctl enable prometheus

# Start Prometheus
sudo systemctl start prometheus

# Check status
sudo systemctl status prometheus
Installing Node Exporter
Node Exporter provides hardware and OS metrics. Install it to monitor your Linux system:
# Download Node Exporter
cd /tmp
wget https://github.com/prometheus/node_exporter/releases/download/v1.6.0/node_exporter-1.6.0.linux-amd64.tar.gz

# Extract
tar xvf node_exporter-1.6.0.linux-amd64.tar.gz

# Copy binary
sudo cp node_exporter-1.6.0.linux-amd64/node_exporter /usr/local/bin/

# Create user
sudo useradd --no-create-home --shell /bin/false node_exporter

# Set ownership
sudo chown node_exporter:node_exporter /usr/local/bin/node_exporter
Create systemd service for Node Exporter:
sudo nano /etc/systemd/system/node_exporter.service[Unit]
Description=Node Exporter
Wants=network-online.target
After=network-online.target
[Service]
User=node_exporter
Group=node_exporter
Type=simple
ExecStart=/usr/local/bin/node_exporter
[Install]
WantedBy=multi-user.targetStart Node Exporter:
sudo systemctl daemon-reload
sudo systemctl enable node_exporter
sudo systemctl start node_exporter
sudo systemctl status node_exporter
PromQL: Prometheus Query Language
PromQL is Prometheus’s functional query language that allows you to select and aggregate time series data in real time.
Basic Query Examples
# Get current CPU usage
100 - (avg by (instance) (irate(node_cpu_seconds_total{mode="idle"}[5m])) * 100)

# Memory usage percentage
(1 - (node_memory_MemAvailable_bytes / node_memory_MemTotal_bytes)) * 100

# Disk usage percentage
(1 - (node_filesystem_avail_bytes{fstype!="tmpfs"} / node_filesystem_size_bytes{fstype!="tmpfs"})) * 100

# Network I/O rate
rate(node_network_receive_bytes_total[5m])
rate(node_network_transmit_bytes_total[5m])

# Load average
node_load1
node_load5
node_load15
Advanced Query Functions
# Rate function - per-second average rate of increase
rate(http_requests_total[5m])

# Increase function - increase in time series
increase(http_requests_total[1h])

# Sum by labels
sum by (job) (rate(http_requests_total[5m]))

# Histogram quantiles
histogram_quantile(0.95, rate(http_request_duration_seconds_bucket[5m]))

# Aggregation functions
avg(node_load1)
max(node_load1)
min(node_load1)
count(up == 1)
Setting Up Alerting
Creating Alert Rules
Create an alert rules file:
sudo nano /etc/prometheus/alert_rules.ymlgroups:
- name: system_alerts
rules:
- alert: HighCPUUsage
expr: 100 - (avg by (instance) (irate(node_cpu_seconds_total{mode="idle"}[5m])) * 100) > 80
for: 5m
labels:
severity: warning
annotations:
summary: "High CPU usage detected"
description: "CPU usage is above 80% for more than 5 minutes on {{ $labels.instance }}"
- alert: HighMemoryUsage
expr: (1 - (node_memory_MemAvailable_bytes / node_memory_MemTotal_bytes)) * 100 > 90
for: 5m
labels:
severity: critical
annotations:
summary: "High memory usage detected"
description: "Memory usage is above 90% on {{ $labels.instance }}"
- alert: DiskSpaceLow
expr: (1 - (node_filesystem_avail_bytes{fstype!="tmpfs"} / node_filesystem_size_bytes{fstype!="tmpfs"})) * 100 > 85
for: 10m
labels:
severity: warning
annotations:
summary: "Disk space running low"
description: "Disk usage is above 85% on {{ $labels.instance }} {{ $labels.mountpoint }}"
- alert: ServiceDown
expr: up == 0
for: 1m
labels:
severity: critical
annotations:
summary: "Service is down"
description: "{{ $labels.job }} on {{ $labels.instance }} has been down for more than 1 minute"Update the Prometheus configuration to include the rules file:
rule_files:
  - "/etc/prometheus/alert_rules.yml"
Installing and Configuring Alertmanager
# Download Alertmanager
cd /tmp
wget https://github.com/prometheus/alertmanager/releases/download/v0.25.0/alertmanager-0.25.0.linux-amd64.tar.gz

# Extract and install
tar xvf alertmanager-0.25.0.linux-amd64.tar.gz
sudo cp alertmanager-0.25.0.linux-amd64/alertmanager /usr/local/bin/
sudo cp alertmanager-0.25.0.linux-amd64/amtool /usr/local/bin/

# Create user and directories
sudo useradd --no-create-home --shell /bin/false alertmanager
sudo mkdir /etc/alertmanager
sudo mkdir /var/lib/alertmanager
sudo chown alertmanager:alertmanager /etc/alertmanager
sudo chown alertmanager:alertmanager /var/lib/alertmanager
Create Alertmanager configuration:
sudo nano /etc/alertmanager/alertmanager.ymlglobal:
smtp_smarthost: 'localhost:587'
smtp_from: '[email protected]'
route:
group_by: ['alertname']
group_wait: 10s
group_interval: 10s
repeat_interval: 1h
receiver: 'web.hook'
receivers:
- name: 'web.hook'
email_configs:
- to: '[email protected]'
subject: 'Prometheus Alert: {{ .GroupLabels.alertname }}'
body: |
{{ range .Alerts }}
Alert: {{ .Annotations.summary }}
Description: {{ .Annotations.description }}
Instance: {{ .Labels.instance }}
{{ end }}
inhibit_rules:
- source_match:
severity: 'critical'
target_match:
severity: 'warning'
equal: ['alertname', 'dev', 'instance']Monitoring Different Services
Database Monitoring
For MySQL monitoring, use the MySQL exporter:
# Install MySQL exporter
wget https://github.com/prometheus/mysqld_exporter/releases/download/v0.14.0/mysqld_exporter-0.14.0.linux-amd64.tar.gz
tar xvf mysqld_exporter-0.14.0.linux-amd64.tar.gz
sudo cp mysqld_exporter-0.14.0.linux-amd64/mysqld_exporter /usr/local/bin/

# Create MySQL user for monitoring
CREATE USER 'prometheus'@'localhost' IDENTIFIED BY 'password';
GRANT PROCESS, REPLICATION CLIENT ON *.* TO 'prometheus'@'localhost';
GRANT SELECT ON performance_schema.* TO 'prometheus'@'localhost';

# Configure connection
echo 'DATA_SOURCE_NAME="prometheus:password@(localhost:3306)/"' | sudo tee /etc/default/mysqld_exporter
Web Server Monitoring
For Nginx monitoring, enable the stub_status module:
# Add to Nginx configuration
location /nginx_status {
    stub_status on;
    access_log off;
    allow 127.0.0.1;
    deny all;
}

# Use nginx-prometheus-exporter
docker run -p 9113:9113 nginx/nginx-prometheus-exporter:0.10.0 -nginx.scrape-uri=http://localhost/nginx_status
Performance Optimization
Storage Configuration
# Optimize storage retention
--storage.tsdb.retention.time=30d
--storage.tsdb.retention.size=10GB

# Configure remote storage for long-term retention
remote_write:
  - url: "https://your-remote-storage/api/v1/write"

remote_read:
  - url: "https://your-remote-storage/api/v1/read"
Memory and CPU Optimization
# Increase memory limit for large deployments
--storage.tsdb.retention.size=50GB
--query.max-concurrency=20
--query.timeout=2m

# Configure scrape intervals based on requirements
scrape_configs:
  - job_name: 'critical-services'
    scrape_interval: 10s
  - job_name: 'regular-services'
    scrape_interval: 30s
  - job_name: 'batch-jobs'
    scrape_interval: 5m
Security Best Practices
Authentication and Authorization
# Enable basic authentication
--web.config.file=/etc/prometheus/web.yml

# Create web configuration file
sudo nano /etc/prometheus/web.yml
basic_auth_users:
admin: $2b$12$hNf2lSsxfm0.i4a.1kVpSOM9uxq0qD5.wLaGz0.j0M2i2UE6i6M2i
tls_server_config:
cert_file: /etc/ssl/certs/prometheus.crt
key_file: /etc/ssl/private/prometheus.keyNetwork Security
# Configure firewall rules
sudo ufw allow 9090/tcp  # Prometheus
sudo ufw allow 9100/tcp  # Node Exporter
sudo ufw allow 9093/tcp  # Alertmanager

# Restrict access to specific IPs
sudo ufw allow from 10.0.0.0/24 to any port 9090
Troubleshooting Common Issues
Service Discovery Problems
# Check service discovery
curl http://localhost:9090/api/v1/targets

# Verify configuration syntax
promtool check config /etc/prometheus/prometheus.yml

# Check rules syntax
promtool check rules /etc/prometheus/alert_rules.yml
Performance Issues
# Monitor Prometheus metrics
up{job="prometheus"}
prometheus_tsdb_symbol_table_size_bytes
prometheus_tsdb_head_series
prometheus_rule_evaluation_duration_seconds

# Check disk usage
du -sh /var/lib/prometheus/

# Monitor query performance
topk(10, rate(prometheus_http_request_duration_seconds_sum[5m]))
Integration with Grafana
Grafana provides excellent visualization capabilities for Prometheus data:
# Install Grafana
sudo apt-get install -y software-properties-common
sudo add-apt-repository "deb https://packages.grafana.com/oss/deb stable main"
wget -q -O - https://packages.grafana.com/gpg.key | sudo apt-key add -
sudo apt-get update
sudo apt-get install grafana

# Start Grafana
sudo systemctl enable grafana-server
sudo systemctl start grafana-server
Configure Prometheus as a data source in Grafana using URL: http://localhost:9090
Conclusion
Prometheus provides a comprehensive monitoring solution for Linux systems with its powerful data model, flexible query language, and robust alerting capabilities. By following this guide, you’ve learned how to install, configure, and optimize Prometheus for effective system monitoring. Regular maintenance, proper security configuration, and thoughtful alert design will ensure your monitoring infrastructure remains reliable and valuable for your operations team.
Remember to regularly update your Prometheus installation, review and refine your alerting rules, and monitor the monitoring system itself to maintain optimal performance and reliability.
Related Posts
metricbeat Linux: Complete Guide to System and Service Metrics Monitoring
Metricbeat is a lightweight shipper that helps you monitor your systems and services by collecting metrics from the operating system...

grafana Linux: Complete Guide to Analytics and Interactive Visualization Platform
Grafana has revolutionized the way organizations visualize and analyze their data on Linux systems. This powerful open-source analytics and interactive...
Telegraf Linux: Complete Guide to Installing and Configuring the Metrics Collection Agent
Telegraf is a powerful, plugin-driven server agent for collecting and reporting metrics from databases, systems, and IoT sensors. As part...

PandoraFMS Linux: Complete Network Monitoring Platform Guide
PandoraFMS is a comprehensive, open-source network monitoring platform that provides complete visibility into your IT infrastructure. This powerful monitoring solution...
ManageEngine Linux: Complete Network Monitoring Solutions Guide
Network monitoring is crucial for maintaining optimal performance and security in Linux environments. ManageEngine provides powerful network monitoring solutions specifically...
Zabbix Linux: Complete Enterprise Monitoring Solution for System Administrators
Zabbix stands as one of the most powerful and comprehensive open-source monitoring solutions available for Linux environments. This enterprise-grade monitoring...

Sensu Linux: Complete Monitoring Framework Guide for System Administrators
Sensu is a powerful, open-source monitoring framework designed to monitor servers, services, application health, and business KPIs. Built with modern...

Zenoss Linux: Complete Guide to IT Infrastructure Monitoring and Management
What is Zenoss and Why Use it on Linux? Zenoss is a powerful, open-source IT infrastructure monitoring platform that provides...
Groundwork Linux: Complete Guide to IT Infrastructure Monitoring and System Health Management
What is Groundwork Linux? Groundwork Linux is a comprehensive open-source IT infrastructure monitoring platform built specifically for Linux environments. It...

auditbeat Linux: Complete Guide to Shipping Audit Data to Elasticsearch
Introduction to auditbeat auditbeat is a lightweight shipper from the Elastic Beat family that collects audit data from the Linux...

InfluxDB Linux: Complete Guide to Time Series Database Installation and Management
InfluxDB is a powerful open-source time series database designed to handle high write and query loads for applications involving time-stamped...
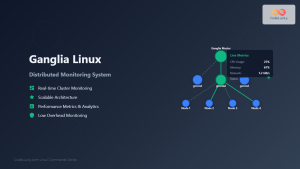
ganglia Linux: Complete Guide to Distributed Monitoring System
Ganglia is a powerful, open-source distributed monitoring system designed specifically for high-performance computing clusters, grids, and cloud infrastructures. Originally developed...