Network monitoring is crucial for maintaining optimal performance and security in Linux environments. Paessler PRTG Network Monitor offers comprehensive monitoring capabilities that can effectively monitor Linux systems, network infrastructure, and applications. This guide provides detailed instructions for implementing PRTG monitoring solutions specifically for Linux environments.
What is Paessler PRTG Network Monitor?
Paessler PRTG (Paessler Router Traffic Grapher) is an enterprise-grade network monitoring solution that provides real-time monitoring of IT infrastructure. While PRTG runs on Windows servers, it excels at monitoring Linux systems through various protocols including SNMP, SSH, and custom scripts.
Key Features for Linux Monitoring
- Multi-protocol support: SNMP, SSH, WMI, and custom sensors
- Agentless monitoring: No need to install agents on Linux targets
- Custom sensors: Execute shell scripts and commands remotely
- Real-time alerting: Immediate notifications for critical issues
- Comprehensive reporting: Detailed performance analytics
Installation and Initial Setup
PRTG Server Requirements
PRTG requires a Windows server for the core installation, but it can monitor unlimited Linux targets:
Minimum Requirements:
- Windows Server 2016 or later
- 4 GB RAM (8 GB recommended)
- 2 CPU cores (4 cores recommended)
- 20 GB free disk space
- Static IP address
Preparing Linux Systems for Monitoring
Before configuring PRTG sensors, prepare your Linux systems by enabling necessary services:
Enable SNMP on Linux
# Install SNMP daemon (Ubuntu/Debian)
sudo apt-get update
sudo apt-get install snmpd snmp-mibs-downloader

# Install SNMP daemon (CentOS/RHEL)
sudo yum install net-snmp net-snmp-utils
# or for newer versions
sudo dnf install net-snmp net-snmp-utils
Configure SNMP Community String
# Edit SNMP configuration
sudo nano /etc/snmp/snmpd.conf

# Add or modify these lines:
# Community string configuration
rocommunity public localhost
rocommunity public 192.168.1.0/24

# System information
syslocation "Data Center, Floor 2"
syscontact "[email protected]"

# Restart SNMP service
sudo systemctl restart snmpd
sudo systemctl enable snmpd
Test SNMP Connectivity
# Test SNMP from PRTG server or another system
snmpwalk -v2c -c public target_linux_ip 1.3.6.1.2.1.1.1

# Expected output:
SNMPv2-MIB::sysDescr.0 = STRING: Linux server01 5.4.0-74-generic #83-Ubuntu SMP
Essential PRTG Sensors for Linux Monitoring
1. SNMP System Health Sensor
Monitor basic system information and uptime:
Sensor Configuration:
- Name: Linux System Health
- SNMP Version: v2c
- Community String: public
- Timeout: 60 seconds

Monitored Parameters:
- System uptime
- System description
- System contact
- System location
Sample Output Display
System Information:
┌─────────────────────┬──────────────────────────────┐
│ Parameter           │ Value                        │
├─────────────────────┼──────────────────────────────┤
│ System Description  │ Linux ubuntu-server 5.15.0  │
│ Uptime             │ 127 days, 14:32:18          │
│ System Contact     │ [email protected]            │
│ System Location    │ Data Center Rack 42          │
└─────────────────────┴──────────────────────────────┘
2. SNMP CPU Load Sensor
Monitor CPU utilization and load averages:
# Configure CPU monitoring OIDs:
1-minute load average: 1.3.6.1.4.1.2021.10.1.3.1
5-minute load average: 1.3.6.1.4.1.2021.10.1.3.2
15-minute load average: 1.3.6.1.4.1.2021.10.1.3.3
CPU user time: 1.3.6.1.4.1.2021.11.9.0
CPU system time: 1.3.6.1.4.1.2021.11.10.0
CPU Load Visualization
CPU Load Average (Last 24 Hours):
    5.0 |                                    *
        |                              *   * *
    4.0 |                            *   *     *
        |                        *             *
    3.0 |                  *   *               *
        |              *       *                 *
    2.0 |          *                               *
        |      *                                     *
    1.0 |  *                                           *
        |*                                               *
    0.0 +─────────────────────────────────────────────────
        00:00   06:00   12:00   18:00   00:00   06:00
3. SNMP Memory Sensor
Monitor memory usage and availability:
Memory Monitoring OIDs:
- Total RAM: 1.3.6.1.4.1.2021.4.5.0
- Available RAM: 1.3.6.1.4.1.2021.4.6.0
- Total Swap: 1.3.6.1.4.1.2021.4.3.0
- Available Swap: 1.3.6.1.4.1.2021.4.4.0
- Cached Memory: 1.3.6.1.4.1.2021.4.15.0
Memory Usage Display
Memory Status:
┌─────────────────┬──────────┬──────────┬───────────┐
│ Type            │ Total    │ Used     │ Available │
├─────────────────┼──────────┼──────────┼───────────┤
│ Physical RAM    │ 16.0 GB  │ 12.3 GB  │ 3.7 GB    │
│ Swap Space      │ 8.0 GB   │ 1.2 GB   │ 6.8 GB    │
│ Cache/Buffers   │ -        │ 2.1 GB   │ -         │
└─────────────────┴──────────┴──────────┴───────────┘

Memory Usage: [████████████████████████████████████████████░░░░░░░░░░] 77%
4. SNMP Disk Space Sensor
Monitor disk usage across file systems:
# Disk monitoring requires NET-SNMP-EXTEND-MIB
# Configure disk monitoring in /etc/snmp/snmpd.conf:

disk / 10000
disk /var 5000
disk /tmp 1000
disk /home 10000

# OIDs for disk monitoring:
Disk path: 1.3.6.1.4.1.2021.9.1.2
Total size: 1.3.6.1.4.1.2021.9.1.6
Available space: 1.3.6.1.4.1.2021.9.1.7
Used percentage: 1.3.6.1.4.1.2021.9.1.9
Disk Usage Report
Disk Space Utilization:
┌──────────────┬───────────┬──────────┬───────────┬────────┐
│ Mount Point  │ Total     │ Used     │ Available │ Usage% │
├──────────────┼───────────┼──────────┼───────────┼────────┤
│ /            │ 50.0 GB   │ 32.1 GB  │ 15.6 GB   │ 67%    │
│ /var         │ 20.0 GB   │ 8.7 GB   │ 10.2 GB   │ 46%    │
│ /home        │ 100.0 GB  │ 78.3 GB  │ 16.8 GB   │ 82%    │
│ /tmp         │ 5.0 GB    │ 0.3 GB   │ 4.4 GB    │ 7%     │
└──────────────┴───────────┴──────────┴───────────┴────────┘
5. SSH Script Sensor
Execute custom monitoring scripts via SSH:
Create Custom Monitoring Script
#!/bin/bash
# /usr/local/bin/prtg_system_check.sh
echo ""
echo ""
# CPU Temperature
if [ -f /sys/class/thermal/thermal_zone0/temp ]; then
temp=$(cat /sys/class/thermal/thermal_zone0/temp)
temp_celsius=$((temp / 1000))
echo ""
echo "CPU Temperature "
echo "$temp_celsius "
echo "Temperature "
echo " "
fi
# Active Connections
connections=$(netstat -an | grep ESTABLISHED | wc -l)
echo ""
echo "Active Connections "
echo "$connections "
echo "Count "
echo " "
# Running Processes
processes=$(ps aux | wc -l)
echo ""
echo "Running Processes "
echo "$processes "
echo "Count "
echo " "
echo " "Make Script Executable
# Set permissions
sudo chmod +x /usr/local/bin/prtg_system_check.sh

# Test script execution
/usr/local/bin/prtg_system_check.sh
Expected XML Output
CPU Temperature
42
Temperature


Active Connections
127
Count


Running Processes
284
Count
Advanced Linux Monitoring Configurations
Docker Container Monitoring
Monitor Docker containers running on Linux systems:
#!/bin/bash
# Docker monitoring script: /usr/local/bin/docker_monitor.sh
echo ""
echo ""
# Running containers
running=$(docker ps -q | wc -l)
echo ""
echo "Running Containers "
echo "$running "
echo "Count "
echo " "
# Total containers
total=$(docker ps -a -q | wc -l)
echo ""
echo "Total Containers "
echo "$total "
echo "Count "
echo " "
# Docker daemon status
if systemctl is-active docker >/dev/null 2>&1; then
status=1
else
status=0
fi
echo ""
echo "Docker Service Status "
echo "$status "
echo "Count "
echo " "
echo " "Apache/Nginx Web Server Monitoring
#!/bin/bash
# Web server monitoring: /usr/local/bin/webserver_monitor.sh
echo ""
echo ""
# Check Apache/Nginx status
if systemctl is-active apache2 >/dev/null 2>&1 || systemctl is-active nginx >/dev/null 2>&1; then
webserver_status=1
# Get response time
response_time=$(curl -w "%{time_total}" -s -o /dev/null http://localhost/ | cut -d. -f1-2)
echo ""
echo "Web Server Status "
echo "$webserver_status "
echo "Count "
echo " "
echo ""
echo "Response Time "
echo "${response_time:-0} "
echo "TimeSeconds "
echo " "
else
echo ""
echo "Web Server Status "
echo "0 "
echo "Count "
echo " "
fi
echo " "Database Connection Monitoring
#!/bin/bash
# MySQL/PostgreSQL monitoring: /usr/local/bin/db_monitor.sh
echo ""
echo ""
# MySQL monitoring
if command -v mysql >/dev/null 2>&1; then
mysql_status=$(mysqladmin ping 2>/dev/null && echo 1 || echo 0)
echo ""
echo "MySQL Status "
echo "$mysql_status "
echo "Count "
echo " "
if [ "$mysql_status" = "1" ]; then
connections=$(mysql -e "SHOW STATUS LIKE 'Threads_connected';" | awk 'NR==2 {print $2}')
echo ""
echo "MySQL Connections "
echo "${connections:-0} "
echo "Count "
echo " "
fi
fi
# PostgreSQL monitoring
if command -v pg_isready >/dev/null 2>&1; then
pg_status=$(pg_isready >/dev/null 2>&1 && echo 1 || echo 0)
echo ""
echo "PostgreSQL Status "
echo "$pg_status "
echo "Count "
echo " "
fi
echo " "Alerting and Notification Setup
Critical Threshold Configuration
Configure appropriate thresholds for Linux systems:
Recommended Thresholds:
┌─────────────────────┬─────────────┬─────────────┬──────────────┐
│ Metric              │ Warning     │ Critical    │ Action       │
├─────────────────────┼─────────────┼─────────────┼──────────────┤
│ CPU Load (1-min)    │ > 2.0       │ > 4.0       │ Email + SMS  │
│ Memory Usage        │ > 85%       │ > 95%       │ Email + SMS  │
│ Disk Usage          │ > 80%       │ > 90%       │ Email        │
│ Disk Free Space     │ < 2 GB      │ < 500 MB    │ Email + SMS  │
│ System Uptime       │ < 1 day     │ Service     │ Email        │
│ SNMP Availability   │ Down > 5min │ Down > 15min│ Email + SMS  │
└─────────────────────┴─────────────┴─────────────┴──────────────┘
Custom Notification Scripts
# Example PowerShell notification script for PRTG
# Save as: NotificationScript.ps1

param(
    [string]$SensorName,
    [string]$Status,
    [string]$DateTime,
    [string]$Message
)

# Slack webhook notification
$SlackWebhook = "https://hooks.slack.com/services/YOUR/WEBHOOK/URL"
$SlackMessage = @{
    text = "PRTG Alert: $SensorName is $Status at $DateTime"
    attachments = @(
        @{
            color = if($Status -eq "Down") {"danger"} else {"warning"}
            fields = @(
                @{
                    title = "Details"
                    value = $Message
                    short = $false
                }
            )
        }
    )
} | ConvertTo-Json -Depth 3

Invoke-RestMethod -Uri $SlackWebhook -Method Post -Body $SlackMessage -ContentType 'application/json'
Performance Optimization Tips
SNMP Configuration Optimization
# Optimize SNMP for better performance
# /etc/snmp/snmpd.conf

# Reduce timeout values
agentxTimeout 10
agentxRetries 1

# Limit community access
rocommunity public 192.168.1.100  # PRTG server IP only

# Disable unnecessary MIBs
dontLogTCPWrappersConnects yes

# Cache OID results
cacheTimeout 30
SSH Key Authentication
Set up SSH key authentication for secure, password-less monitoring:
# Generate SSH key pair on PRTG server
ssh-keygen -t rsa -b 4096 -C "prtg-monitoring"

# Copy public key to Linux targets
ssh-copy-id -i ~/.ssh/id_rsa.pub monitor@target-server

# Test key-based authentication
ssh -i ~/.ssh/id_rsa monitor@target-server 'echo "SSH connection successful"'
Troubleshooting Common Issues
SNMP Connection Problems
# Verify SNMP service status
sudo systemctl status snmpd

# Check SNMP port accessibility
sudo netstat -tulpn | grep :161

# Test SNMP walk from PRTG server
snmpwalk -v2c -c public TARGET_IP 1.3.6.1.2.1.1

# Common solutions:
1. Verify firewall rules allow port 161/UDP
2. Check community string configuration
3. Ensure SNMP daemon is running and enabled
SSH Script Execution Issues
# Debug SSH connectivity
ssh -v monitor@target-server

# Check script permissions
ls -la /usr/local/bin/prtg_*

# Test script execution manually
ssh monitor@target-server '/usr/local/bin/prtg_system_check.sh'

# Common fixes:
1. Verify SSH key authentication
2. Check script execute permissions (chmod +x)
3. Ensure script dependencies are installed
Best Practices and Security
Security Considerations
- Network Isolation: Place PRTG in a dedicated monitoring VLAN
- Credential Management: Use unique, strong passwords for SNMP communities
- SSH Hardening: Implement SSH key authentication and disable password login
- Firewall Rules: Restrict monitoring traffic to specific source IPs
- Regular Updates: Keep both PRTG and monitored systems updated
Monitoring Strategy
Monitoring Hierarchy:
1. Infrastructure Layer
   ├── Network connectivity (Ping sensors)
   ├── Basic system health (SNMP)
   └── Hardware status (Temperature, fans)

2. Operating System Layer
   ├── CPU, Memory, Disk usage
   ├── Process monitoring
   └── Log file monitoring

3. Application Layer
   ├── Service availability
   ├── Application performance
   └── Custom application metrics
Conclusion
Paessler PRTG provides comprehensive monitoring capabilities for Linux environments through its flexible sensor architecture and multi-protocol support. By implementing the sensors and configurations outlined in this guide, you can achieve complete visibility into your Linux infrastructure performance and health.
The combination of SNMP monitoring for standard metrics, SSH-based custom scripts for specialized monitoring, and proper alerting ensures that critical issues are detected and addressed promptly. Regular maintenance of monitoring configurations and security practices will help maintain an effective monitoring solution that scales with your infrastructure needs.
Remember to regularly review and update your monitoring thresholds based on baseline performance data and changing infrastructure requirements. This proactive approach to Linux system monitoring will help prevent downtime and optimize system performance across your environment.
Related Posts

ManageEngine Linux: Complete Network Monitoring Solutions Guide
Network monitoring is crucial for maintaining optimal performance and security in Linux environments. ManageEngine provides powerful network monitoring solutions specifically...

whatsup Linux: Complete Network Monitoring and System Administration Guide
whatsup is a powerful network monitoring and system administration tool for Linux that provides real-time insights into network connectivity, system...
SNMP Command Linux: Complete Guide to Simple Network Management Protocol Configuration and Usage
Introduction to SNMP Command in Linux Simple Network Management Protocol (SNMP) is a fundamental protocol used for monitoring and managing...

iptraf Command Linux: Complete Interactive Network Monitoring Guide
The iptraf command is a powerful console-based network monitoring utility for Linux systems that provides real-time IP LAN monitoring capabilities....

nagios Linux: Complete Infrastructure Monitoring System Setup Guide
Introduction to Nagios Nagios is one of the most popular open-source infrastructure monitoring systems available for Linux environments. Originally developed...

SolarWinds Linux: Complete Network Performance Monitor Guide for System Administrators
SolarWinds Network Performance Monitor (NPM) is a powerful network monitoring solution that provides comprehensive visibility into network infrastructure performance. While...

intermapper Linux: Complete Network Monitoring and Mapping Guide
What is InterMapper for Linux? InterMapper is a powerful network monitoring and mapping tool that provides real-time visibility into network...

observium Linux: Complete Network Management and Monitoring Platform Guide
Observium is a powerful, auto-discovering network monitoring platform designed for Linux systems that provides comprehensive visibility into network infrastructure. This...
netstat Command Linux: Complete Guide to Network Connection Monitoring
The netstat command is one of the most essential network monitoring tools in Linux systems. It provides comprehensive information about...
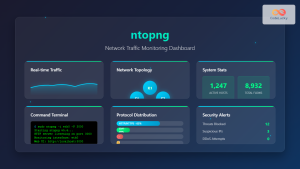
ntopng Command Linux: Complete Guide to Web-Based Network Traffic Monitoring
Network traffic monitoring is crucial for maintaining optimal network performance, security, and troubleshooting connectivity issues. The ntopng command provides a...
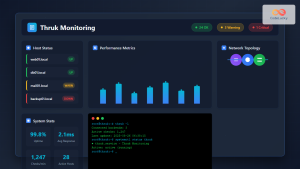
thruk Linux: Comprehensive Monitoring Web Interface for Network Infrastructure
Thruk is a powerful web-based monitoring interface designed primarily for Nagios and compatible monitoring systems. As a comprehensive frontend solution,...
nethogs Command Linux: Monitor Real-Time Network Usage by Process
Network monitoring is a crucial aspect of system administration, especially when you need to identify which processes are consuming bandwidth...