In today’s mobile-first world, understanding how users interact with your app is crucial for retention, engagement, and overall success. Mobile analytics is the practice of measuring and analyzing user behavior, app performance, and user experience (UX) within mobile applications.
This detailed guide explains how to track mobile user experience effectively using mobile analytics tools and techniques. It includes practical examples and visual diagrams to enhance understanding and application in real-world development.
What Is Mobile Analytics and Why It Matters
Mobile analytics allows product managers, developers, and marketers to collect real-time data on app usage, user engagement, crashes, and other performance metrics. The insights help optimize the app, improve UX, and increase monetization opportunities.
- Track user sessions, screen views, and navigation flows
- Analyze app load times and crash reports
- Measure user retention and churn
- Identify friction points in user experience
- Make data-driven decisions for new features or UI improvements
Key Mobile User Experience Metrics to Track
To effectively track mobile UX, focus on these essential metrics:
- App Launch Time: Time taken to start the app completely
- Screen Load Time: How fast each screen or view loads
- Session Length: Duration of user sessions
- Retention Rate: Percentage of users returning after their first visit
- Crash Rate: Frequency of app crashes or errors
- User Flow: Path users take through the app
- Conversion Rate: Completion of key actions like signups or purchases
Example: Tracking App Launch Time and Crashes with Firebase Analytics
Firebase Analytics offers out-of-the-box tracking and custom event logging. Here’s a quick example of integrating Firebase to track app launch duration and crash reporting.
// Initialize Firebase in your React Native or Android app
import analytics from '@react-native-firebase/analytics';
import crashlytics from '@react-native-firebase/crashlytics';

// Log app open event to track launches
async function logAppOpen() {
  await analytics().logEvent('app_open');
}

// Measure app launch time (simplified)
let appStart = Date.now();
function logAppLaunchTime() {
  const launchTime = Date.now() - appStart;
  analytics().logEvent('app_launch_time', { launchTime });
}

// Setup Crashlytics to capture crashes
function simulateCrash() {
  crashlytics().crash(); // Forces a crash to test reporting
}

logAppOpen();
logAppLaunchTime();
Firebase Analytics automatically collects valuable data and Crashlytics provides detailed crash logs accessible via Firebase console.
User Flow Visualization with Mermaid Diagram

This flowchart helps visualize the common user navigation and UX flow inside a mobile app, which can be tracked with event tags.
How to Implement Interactive User Experience Tracking
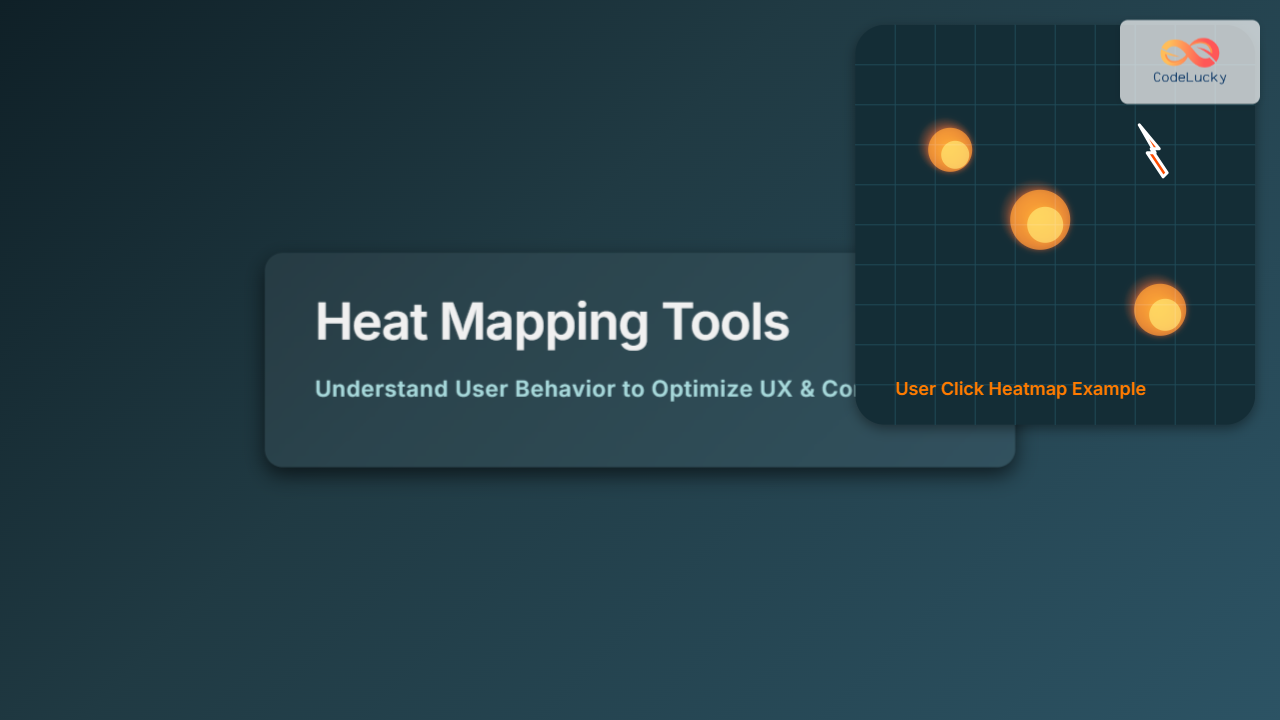
For deeper insight, interactive tracking using heatmaps, touch interactions, and gesture analytics can greatly aid UX improvement. Tools like Smartlook, Mixpanel, and Appsee enable capturing real user interactions with visual replay.
Example snippet integrating Mixpanel for event tracking on user taps:
// Track user interaction on button tap with Mixpanel
import mixpanel from 'mixpanel-browser';

// Initialize Mixpanel
mixpanel.init("YOUR_PROJECT_TOKEN");

// Function to track button tap event
function onButtonTap() {
  mixpanel.track("Button_Tapped", { buttonName: "Subscribe" });
}
Visualizing Key Metrics Over Time

This linear diagram can be mapped to charts depicting user retention and session frequency, helping product teams plan retention strategies based on real data.
Best Practices for Mobile Analytics Implementation
- Define Clear Goals: Identify which UX metrics matter most to your app’s success.
- Implement Consistent Event Naming: Standardize event names for easier analysis across tools.
- Capture User Segments: Track behavior by demographics, device type, or app version.
- Set Up Real-Time Dashboards: Monitor key performance indicators continuously.
- Use Data to Iterate Fast: Use analytics to enhance UX steadily with A/B tests and feature updates.
Example: Tracking User Funnel for Signup Conversion

This simple funnel map guides developers to instrument events at each step to identify drop-offs preventing signup completion.
Conclusion
Tracking mobile user experience through detailed analytics is essential for building successful apps. By measuring app performance, user flows, crashes, and interactive behaviors, teams can optimize UX and drive engagement.
The best approach combines quantitative metrics with visual tracking and user flow diagrams as outlined in this guide to empower data-driven product improvements.