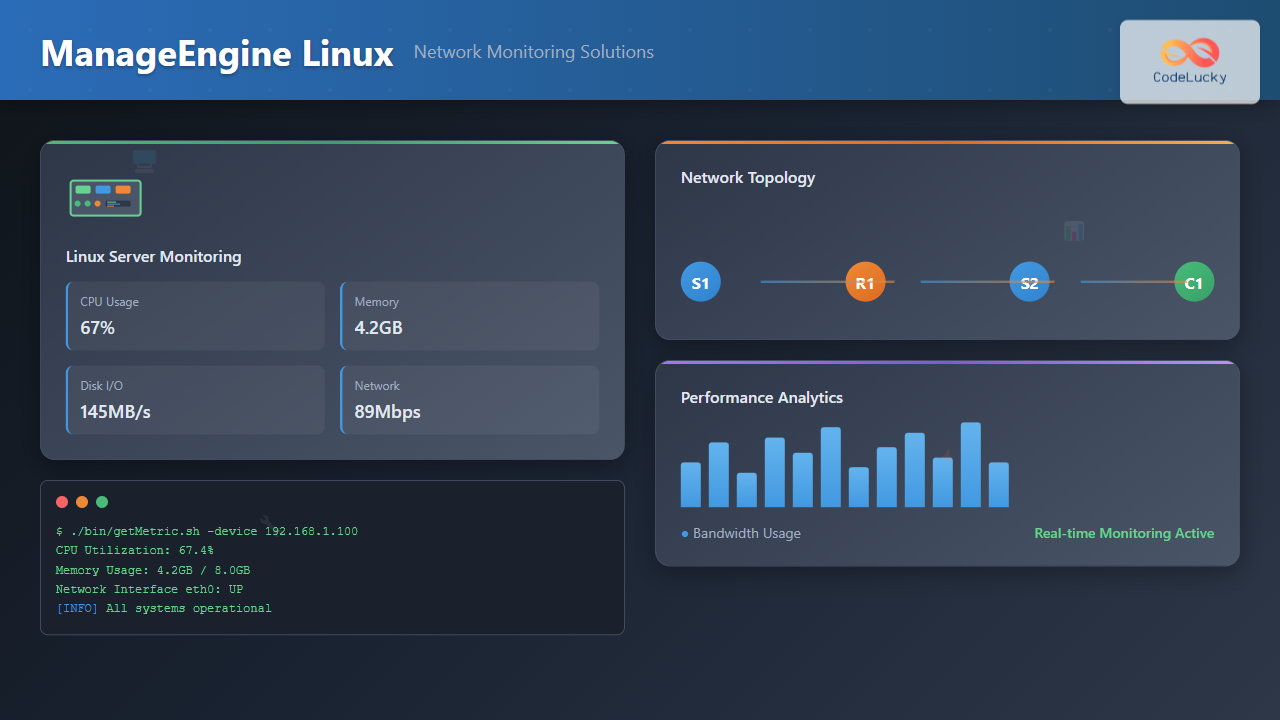
Network monitoring is crucial for maintaining optimal performance and security in Linux environments. ManageEngine provides powerful network monitoring solutions specifically designed for Linux systems, offering comprehensive visibility into network infrastructure, server performance, and application health.
Understanding ManageEngine Network Monitoring on Linux
ManageEngine OpManager serves as the primary network monitoring solution for Linux environments, providing real-time monitoring capabilities for network devices, servers, and applications. The platform supports various Linux distributions including Ubuntu, CentOS, Red Hat Enterprise Linux, and SUSE Linux Enterprise Server.
Key Features of ManageEngine Linux Monitoring
- SNMP-based monitoring for network devices and Linux servers
- Real-time performance metrics including CPU, memory, and disk usage
- Network topology discovery and visualization
- Automated alerting system with customizable thresholds
- Historical data analysis and reporting capabilities
Installing ManageEngine OpManager on Linux
The installation process for ManageEngine OpManager on Linux requires specific system requirements and configuration steps.
System Requirements
Before installation, ensure your Linux system meets the following requirements:
• CPU: 2.4 GHz dual-core processor
• RAM: 4 GB (8 GB recommended)
• Disk Space: 10 GB free space
• Java: OpenJDK 8 or Oracle JDK 8
• Operating System: 64-bit Linux distribution
Installation Commands
Follow these commands to install ManageEngine OpManager on your Linux system:
# Download OpManager for Linux
wget https://archives.manageengine.com/opmanager/latest/ManageEngine_OpManager.bin

# Make the installer executable
chmod +x ManageEngine_OpManager.bin

# Run the installer
sudo ./ManageEngine_OpManager.bin

# Start OpManager service
sudo /opt/ManageEngine/OpManager/bin/OpManager.sh start
Post-Installation Configuration
After installation, configure the basic settings using the following commands:
# Navigate to OpManager directory
cd /opt/ManageEngine/OpManager

# Configure database settings
sudo ./bin/changeDBServer.sh

# Set admin password
sudo ./bin/ChangePassword.sh

# Configure SNMP settings
sudo ./bin/configureSNMP.sh
Configuring Network Discovery
Network discovery is essential for identifying and monitoring devices in your Linux network infrastructure.
SNMP Configuration for Linux Servers
Configure SNMP on your Linux servers to enable monitoring:
# Install SNMP on Ubuntu/Debian
sudo apt-get update
sudo apt-get install snmp snmp-mibs-downloader

# Install SNMP on CentOS/RHEL
sudo yum install net-snmp net-snmp-utils

# Configure SNMP community string
sudo nano /etc/snmp/snmpd.conf

# Add the following lines:
# rocommunity public 127.0.0.1
# rocommunity public [OpManager_IP]

# Start SNMP service
sudo systemctl start snmpd
sudo systemctl enable snmpd
Adding Linux Servers to OpManager
Use the OpManager CLI to add Linux servers for monitoring:
# Add device using CLI
./bin/addDevice.sh -ip 192.168.1.100 -community public -type linux

# Bulk add devices from file
./bin/bulkAddDevices.sh -file /path/to/devices.csv

# Verify device addition
./bin/listDevices.sh | grep "192.168.1.100"
Device ID: 12345, IP: 192.168.1.100, Status: Up, Type: Linux Server
Monitoring Linux Server Performance
ManageEngine provides comprehensive performance monitoring for Linux servers with real-time metrics and historical analysis.
CPU Monitoring Commands
Monitor CPU performance using built-in OpManager commands:
# Get current CPU utilization
./bin/getMetric.sh -device 192.168.1.100 -metric cpu_utilization

# Monitor CPU load average
./bin/getMetric.sh -device 192.168.1.100 -metric load_average

# Generate CPU performance report
./bin/generateReport.sh -type performance -device 192.168.1.100 -metric cpu
Memory and Disk Monitoring
Track memory usage and disk space with these monitoring commands:
# Monitor memory utilization
./bin/getMetric.sh -device 192.168.1.100 -metric memory_utilization

# Check disk space usage
./bin/getMetric.sh -device 192.168.1.100 -metric disk_utilization

# Monitor specific disk partition
./bin/getMetric.sh -device 192.168.1.100 -metric disk_utilization -partition /dev/sda1
Memory Utilization: 65.4%
Disk Utilization (/): 78.2%
Disk Utilization (/var): 45.6%
Network Interface Monitoring
Monitoring network interfaces is crucial for identifying bandwidth usage and network performance issues.
Interface Discovery and Monitoring
# Discover network interfaces
./bin/discoverInterfaces.sh -device 192.168.1.100

# Monitor interface bandwidth utilization
./bin/getMetric.sh -device 192.168.1.100 -metric interface_utilization -interface eth0

# Get interface statistics
./bin/getInterfaceStats.sh -device 192.168.1.100 -interface eth0
Bandwidth Threshold Configuration
Set up bandwidth thresholds for proactive monitoring:
# Set bandwidth threshold
./bin/setThreshold.sh -device 192.168.1.100 -metric interface_utilization -interface eth0 -warning 80 -critical 95

# Configure traffic spike detection
./bin/configureTrafficSpike.sh -device 192.168.1.100 -interface eth0 -threshold 90
Alert Configuration and Management
Effective alerting ensures prompt response to network issues and performance degradation.
Creating Alert Profiles
# Create alert profile for Linux servers
./bin/createAlertProfile.sh -name "Linux_Server_Alerts" -type linux

# Configure email notifications
./bin/configureEmailAlert.sh -profile "Linux_Server_Alerts" -email [email protected]

# Set SMS alerts
./bin/configureSMSAlert.sh -profile "Linux_Server_Alerts" -number +1234567890
Custom Alert Rules
Create custom alert rules for specific monitoring scenarios:
# Create CPU threshold alert
./bin/createAlert.sh -name "High_CPU_Usage" -condition "cpu_utilization > 85" -action email

# Create disk space alert
./bin/createAlert.sh -name "Low_Disk_Space" -condition "disk_utilization > 90" -action "email,sms"

# Create network interface down alert
./bin/createAlert.sh -name "Interface_Down" -condition "interface_status = down" -action email
Process and Service Monitoring
Monitor critical processes and services running on Linux servers to ensure application availability.
Process Monitoring Setup
# Add process monitoring
./bin/addProcessMonitor.sh -device 192.168.1.100 -process "httpd" -instances 2

# Monitor database processes
./bin/addProcessMonitor.sh -device 192.168.1.100 -process "mysqld" -instances 1

# Check process status
./bin/getProcessStatus.sh -device 192.168.1.100
Service Monitoring Commands
# Monitor HTTP service
./bin/addServiceMonitor.sh -device 192.168.1.100 -service http -port 80

# Monitor SSH service
./bin/addServiceMonitor.sh -device 192.168.1.100 -service ssh -port 22

# Monitor custom application port
./bin/addServiceMonitor.sh -device 192.168.1.100 -service "custom_app" -port 8080
Log File Monitoring
Monitor critical log files for error patterns and security events.
Log Monitoring Configuration
# Add log file monitoring
./bin/addLogMonitor.sh -device 192.168.1.100 -logfile "/var/log/messages" -pattern "ERROR"

# Monitor Apache access logs
./bin/addLogMonitor.sh -device 192.168.1.100 -logfile "/var/log/apache2/access.log" -pattern "404"

# Monitor security logs
./bin/addLogMonitor.sh -device 192.168.1.100 -logfile "/var/log/auth.log" -pattern "Failed password"
Reporting and Analytics
Generate comprehensive reports for performance analysis and capacity planning.
Performance Reports
# Generate daily performance report
./bin/generateReport.sh -type daily -device 192.168.1.100 -output /tmp/daily_report.pdf

# Create monthly capacity report
./bin/generateReport.sh -type capacity -period monthly -device 192.168.1.100

# Generate network utilization report
./bin/generateReport.sh -type network -period weekly -device 192.168.1.100
Custom Dashboard Creation
# Create custom dashboard
./bin/createDashboard.sh -name "Linux_Infrastructure" -widgets "cpu,memory,disk,network"

# Add devices to dashboard
./bin/addToDashboard.sh -dashboard "Linux_Infrastructure" -device 192.168.1.100

# Export dashboard configuration
./bin/exportDashboard.sh -dashboard "Linux_Infrastructure" -output /tmp/dashboard.json
Automation and Scripting
Automate routine monitoring tasks using ManageEngine’s scripting capabilities.
Automated Device Discovery
# Create discovery script
#!/bin/bash
# auto_discovery.sh

SUBNET="192.168.1.0/24"
COMMUNITY="public"

./bin/networkDiscovery.sh -subnet $SUBNET -community $COMMUNITY -type linux

# Schedule discovery with cron
# 0 2 * * * /opt/ManageEngine/OpManager/auto_discovery.sh
Health Check Automation
# Automated health check script
#!/bin/bash
# health_check.sh

DEVICES_FILE="/opt/ManageEngine/OpManager/conf/devices.txt"

while read device; do
    status=$(./bin/pingDevice.sh -device $device)
    if [ "$status" != "UP" ]; then
        echo "Device $device is DOWN" | mail -s "Device Alert" [email protected]
    fi
done < $DEVICES_FILE
Troubleshooting Common Issues
Address common issues encountered when monitoring Linux systems with ManageEngine.
SNMP Connectivity Issues
Solution: Verify SNMP configuration and firewall settings
# Test SNMP connectivity
snmpwalk -v2c -c public 192.168.1.100 1.3.6.1.2.1.1.1.0

# Check firewall status
sudo ufw status
sudo firewall-cmd --list-all

# Open SNMP port
sudo ufw allow from [OpManager_IP] to any port 161
sudo firewall-cmd --add-port=161/udp --permanent
Performance Optimization
Optimize OpManager performance for large-scale Linux environments:
# Increase Java memory allocation
sudo nano /opt/ManageEngine/OpManager/bin/OpManager.sh
# Add: -Xmx8192m -Xms2048m

# Optimize database performance
./bin/optimizeDB.sh

# Configure monitoring intervals
./bin/setPollingInterval.sh -interval 300 -type performance
Best Practices for Linux Network Monitoring
Implement these best practices to maximize the effectiveness of your ManageEngine Linux monitoring setup:
Monitoring Strategy
- Baseline establishment: Monitor systems for 2-4 weeks to establish performance baselines
- Threshold tuning: Adjust alert thresholds based on historical data and business requirements
- Monitoring intervals: Use appropriate polling intervals based on criticality (1-5 minutes for critical systems)
- Resource planning: Monitor trends for capacity planning and resource allocation
Security Considerations
# Secure SNMP configuration
# Use SNMPv3 with authentication
sudo nano /etc/snmp/snmpd.conf

# Add SNMPv3 user
createUser monitoring SHA authpassphrase AES privpassphrase
rouser monitoring

# Restart SNMP service
sudo systemctl restart snmpd
Integration with Linux System Tools
Enhance monitoring capabilities by integrating ManageEngine with native Linux monitoring tools.
Integration with Nagios Plugins
# Install Nagios plugins
sudo apt-get install nagios-plugins-basic nagios-plugins-standard

# Configure custom script execution
./bin/addCustomScript.sh -device 192.168.1.100 -script "/usr/lib/nagios/plugins/check_disk" -args "-w 20% -c 10% -p /"

# Execute custom monitoring script
./bin/executeScript.sh -device 192.168.1.100 -script "check_disk"
Syslog Integration
Configure syslog forwarding for centralized log monitoring:
# Configure rsyslog forwarding
sudo nano /etc/rsyslog.conf

# Add line for OpManager syslog server
*.* @@[OpManager_IP]:514

# Restart rsyslog service
sudo systemctl restart rsyslog

# Configure OpManager syslog receiver
./bin/configureSyslog.sh -port 514 -facility local0
ManageEngine provides comprehensive network monitoring solutions for Linux environments, offering detailed visibility into system performance, network health, and application status. By implementing proper configuration, automation, and best practices, organizations can maintain optimal network performance and quickly respond to issues before they impact business operations.
The combination of real-time monitoring, automated alerting, and comprehensive reporting makes ManageEngine an effective choice for Linux network monitoring in enterprise environments. Regular maintenance, threshold optimization, and integration with existing tools ensure maximum value from your monitoring investment.

