What is Logstash?
Logstash is a powerful, open-source data processing pipeline that ingests data from multiple sources simultaneously, transforms it, and sends it to your favorite “stash” like Elasticsearch. Part of the Elastic Stack (formerly ELK Stack), Logstash excels at collecting, parsing, and transforming logs and events from various sources into a common format.
On Linux systems, Logstash serves as the central hub for data processing, capable of handling everything from simple log forwarding to complex data enrichment and transformation tasks. It’s designed to handle data from any source, in any format, with over 200 plugins available for different inputs, filters, and outputs.
Installing Logstash on Linux
Installation via Package Manager (Recommended)
The most straightforward way to install Logstash on Linux is through the official Elastic repository:
# Add Elastic repository GPG key
wget -qO - https://artifacts.elastic.co/GPG-KEY-elasticsearch | sudo apt-key add -

# Add repository to sources list
echo "deb https://artifacts.elastic.co/packages/8.x/apt stable main" | sudo tee /etc/apt/sources.list.d/elastic-8.x.list

# Update package list and install
sudo apt update
sudo apt install logstash
For Red Hat-based systems (CentOS, RHEL, Fedora):
# Add Elastic repository
sudo rpm --import https://artifacts.elastic.co/GPG-KEY-elasticsearch

# Create repository file
cat << EOF | sudo tee /etc/yum.repos.d/elastic.repo
[elastic-8.x]
name=Elastic repository for 8.x packages
baseurl=https://artifacts.elastic.co/packages/8.x/yum
gpgcheck=1
gpgkey=https://artifacts.elastic.co/GPG-KEY-elasticsearch
enabled=1
autorefresh=1
type=rpm-md
EOF

# Install Logstash
sudo yum install logstash
Manual Installation
For manual installation, download the appropriate package:
# Download Logstash (replace version as needed)
wget https://artifacts.elastic.co/downloads/logstash/logstash-8.11.0-linux-x86_64.tar.gz

# Extract archive
tar -xzf logstash-8.11.0-linux-x86_64.tar.gz

# Move to desired location
sudo mv logstash-8.11.0 /opt/logstash

# Create symlink for easier access
sudo ln -s /opt/logstash/bin/logstash /usr/local/bin/logstash
Logstash Configuration Fundamentals
Logstash configurations follow a simple three-section structure: input, filter, and output. Each section defines how data flows through the pipeline.
Basic Configuration Structure
input {
  # Define data sources
}

filter {
  # Transform and enrich data
}

output {
  # Send processed data to destinations
}
Configuration File Location
Logstash configuration files are typically stored in:
/etc/logstash/conf.d/– Main configuration directory/etc/logstash/logstash.yml– Main settings file/etc/logstash/pipelines.yml– Pipeline definitions
Essential Logstash Commands
Starting and Managing Logstash
# Start Logstash service
sudo systemctl start logstash

# Enable auto-start on boot
sudo systemctl enable logstash

# Check service status
sudo systemctl status logstash

# Stop Logstash
sudo systemctl stop logstash

# Restart Logstash
sudo systemctl restart logstash
Running Logstash with Custom Configuration
# Run with specific configuration file
/usr/share/logstash/bin/logstash -f /path/to/config.conf

# Test configuration syntax
/usr/share/logstash/bin/logstash -f /path/to/config.conf --config.test_and_exit

# Run in debug mode
/usr/share/logstash/bin/logstash -f /path/to/config.conf --log.level debug
Input Plugins and Configuration
File Input Plugin
The file input plugin is one of the most commonly used inputs for reading log files:
input {
  file {
    path => "/var/log/apache2/access.log"
    start_position => "beginning"
    sincedb_path => "/dev/null"
    codec => "plain"
  }
}
Expected Output: Logstash will continuously monitor the specified log file and process new entries as they’re written.
Beats Input Plugin
For receiving data from Beats (Filebeat, Metricbeat, etc.):
input {
  beats {
    port => 5044
    host => "0.0.0.0"
  }
}
Syslog Input Plugin
To receive syslog messages over the network:
input {
  syslog {
    port => 514
    type => "syslog"
  }
}
TCP Input Plugin
For receiving data over TCP connections:
input {
  tcp {
    port => 9999
    codec => json_lines
  }
}
Filter Plugins for Data Processing
Grok Filter
Grok is the primary filter for parsing unstructured log data into structured data:
filter {
  grok {
    match => { "message" => "%{COMMONAPACHELOG}" }
  }
}
Custom grok patterns for specific log formats:
filter {
  grok {
    match => {
      "message" => "%{TIMESTAMP_ISO8601:timestamp} %{LOGLEVEL:level} %{GREEDYDATA:message}"
    }
  }
}
Date Filter
Parse timestamps and set the @timestamp field:
filter {
  date {
    match => [ "timestamp", "yyyy-MM-dd HH:mm:ss" ]
    target => "@timestamp"
  }
}
Mutate Filter
Modify fields, rename, remove, or add fields:
filter {
  mutate {
    rename => { "old_field" => "new_field" }
    remove_field => [ "unwanted_field" ]
    add_field => { "environment" => "production" }
    convert => { "response_time" => "integer" }
  }
}
Conditional Processing
Apply filters conditionally based on field values:
filter {
  if [type] == "apache" {
    grok {
      match => { "message" => "%{COMMONAPACHELOG}" }
    }
  } else if [type] == "nginx" {
    grok {
      match => { "message" => "%{NGINXACCESS}" }
    }
  }
}
Output Plugins and Destinations
Elasticsearch Output
Send processed data to Elasticsearch:
output {
  elasticsearch {
    hosts => ["localhost:9200"]
    index => "logstash-%{+YYYY.MM.dd}"
    document_type => "_doc"
  }
}
File Output
Write processed data to files:
output {
  file {
    path => "/var/log/logstash/processed-%{+YYYY-MM-dd}.log"
    codec => line { format => "%{timestamp} %{level} %{message}" }
  }
}
Stdout Output (for Testing)
Display output in the console for debugging:
output {
  stdout {
    codec => rubydebug
  }
}
Real-World Configuration Examples
Apache Log Processing Pipeline
Complete configuration for processing Apache access logs:
input {
  file {
    path => "/var/log/apache2/access.log"
    start_position => "beginning"
    sincedb_path => "/var/lib/logstash/sincedb_apache"
    type => "apache"
  }
}

filter {
  if [type] == "apache" {
    grok {
      match => { "message" => "%{COMMONAPACHELOG}" }
    }

    date {
      match => [ "timestamp", "dd/MMM/yyyy:HH:mm:ss Z" ]
    }

    if [response] {
      mutate {
        convert => { "response" => "integer" }
      }
    }

    if [bytes] {
      mutate {
        convert => { "bytes" => "integer" }
      }
    }

    mutate {
      remove_field => [ "timestamp", "message" ]
    }
  }
}

output {
  elasticsearch {
    hosts => ["localhost:9200"]
    index => "apache-logs-%{+YYYY.MM.dd}"
  }

  stdout {
    codec => rubydebug
  }
}
Multi-Input Pipeline
Configuration handling multiple log sources:
input {
  file {
    path => "/var/log/nginx/access.log"
    type => "nginx"
    tags => ["nginx", "access"]
  }

  file {
    path => "/var/log/nginx/error.log"
    type => "nginx"
    tags => ["nginx", "error"]
  }

  file {
    path => "/var/log/syslog"
    type => "syslog"
    tags => ["system"]
  }
}

filter {
  if "nginx" in [tags] and "access" in [tags] {
    grok {
      match => { "message" => "%{NGINXACCESS}" }
    }
  } else if "nginx" in [tags] and "error" in [tags] {
    grok {
      match => { "message" => "%{NGINXERROR}" }
    }
  } else if [type] == "syslog" {
    grok {
      match => { "message" => "%{SYSLOGTIMESTAMP:timestamp} %{IPORHOST:host} %{PROG:program}: %{GREEDYDATA:message}" }
      overwrite => [ "message" ]
    }
  }

  date {
    match => [ "timestamp", "MMM dd HH:mm:ss", "MMM  d HH:mm:ss" ]
  }
}

output {
  if [type] == "nginx" {
    elasticsearch {
      hosts => ["localhost:9200"]
      index => "nginx-%{+YYYY.MM.dd}"
    }
  } else if [type] == "syslog" {
    elasticsearch {
      hosts => ["localhost:9200"]
      index => "syslog-%{+YYYY.MM.dd}"
    }
  }
}
Performance Tuning and Optimization
Pipeline Configuration
Optimize Logstash performance by tuning pipeline settings in /etc/logstash/logstash.yml:
# Pipeline workers (usually CPU cores)
pipeline.workers: 4

# Batch size for processing
pipeline.batch.size: 1000

# Batch delay
pipeline.batch.delay: 50

# Pipeline buffer size
pipeline.queue.max_bytes: 1gb

# Enable persistent queues
queue.type: persisted
JVM Settings
Configure JVM heap size in /etc/logstash/jvm.options:
# Set heap size (should be 50% of available RAM)
-Xms2g
-Xmx2g

# Garbage collection settings
-XX:+UseG1GC
-XX:MaxGCPauseMillis=200
Monitoring and Troubleshooting
Monitoring APIs
Logstash provides APIs for monitoring:
# Check node info
curl -XGET "localhost:9600/_node?pretty"

# Check pipeline stats
curl -XGET "localhost:9600/_node/stats/pipelines?pretty"

# Check hot threads
curl -XGET "localhost:9600/_node/hot_threads?pretty"
Log File Monitoring
Monitor Logstash logs for troubleshooting:
# View Logstash logs
sudo tail -f /var/log/logstash/logstash-plain.log

# Check for errors
sudo grep -i error /var/log/logstash/logstash-plain.log

# Monitor with journalctl
sudo journalctl -u logstash -f
Common Troubleshooting Commands
# Test configuration syntax
sudo -u logstash /usr/share/logstash/bin/logstash --path.settings /etc/logstash -t

# Check configuration files
sudo /usr/share/logstash/bin/logstash --path.settings /etc/logstash --config.test_and_exit

# Run in debug mode
sudo -u logstash /usr/share/logstash/bin/logstash --path.settings /etc/logstash --log.level debug
Security Considerations
File Permissions
Ensure proper file permissions for security:
# Set ownership for Logstash files
sudo chown -R logstash:logstash /etc/logstash/
sudo chown -R logstash:logstash /var/log/logstash/
sudo chown -R logstash:logstash /var/lib/logstash/

# Set proper permissions
sudo chmod 640 /etc/logstash/conf.d/*.conf
sudo chmod 600 /etc/logstash/logstash.yml
Network Security
Configure secure communication with Elasticsearch:
output {
  elasticsearch {
    hosts => ["https://localhost:9200"]
    user => "logstash_writer"
    password => "secure_password"
    ssl => true
    ssl_certificate_verification => true
    cacert => "/path/to/ca.crt"
  }
}
Integration with Elastic Stack
Filebeat to Logstash
Configure Filebeat to send data to Logstash:
# Filebeat configuration
output.logstash:
  hosts: ["localhost:5044"]

input {
  beats {
    port => 5044
  }
}
Logstash to Kibana
Data processed by Logstash and stored in Elasticsearch is automatically available in Kibana for visualization and analysis.
Advanced Features
Multiple Pipelines
Configure multiple pipelines in /etc/logstash/pipelines.yml:
- pipeline.id: apache
  path.config: "/etc/logstash/conf.d/apache.conf"
  pipeline.workers: 2

- pipeline.id: nginx
  path.config: "/etc/logstash/conf.d/nginx.conf"
  pipeline.workers: 2
Dead Letter Queue
Handle failed events with dead letter queue:
# Enable in logstash.yml
dead_letter_queue.enable: true
dead_letter_queue.max_bytes: 1gb

# Process dead letter queue
input {
  dead_letter_queue {
    path => "/var/lib/logstash/dead_letter_queue"
    pipeline_id => "main"
  }
}
Best Practices
- Configuration Management: Use version control for configuration files
- Resource Monitoring: Monitor CPU, memory, and disk usage regularly
- Field Naming: Use consistent field naming conventions
- Error Handling: Implement proper error handling and logging
- Testing: Test configurations in development environments first
- Documentation: Document custom grok patterns and configurations
- Security: Regularly update Logstash and secure network communications
Logstash on Linux provides a robust foundation for building scalable data processing pipelines. By following these examples and best practices, you can create efficient log processing systems that handle large volumes of data while maintaining performance and reliability. Regular monitoring and optimization ensure your Logstash deployment continues to meet your data processing requirements as they evolve.
Related Posts
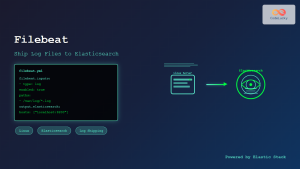
filebeat Linux: Complete Guide to Ship Log Files to Elasticsearch with Real Examples
Filebeat is a lightweight log shipper that belongs to the Elastic Stack (formerly ELK Stack) ecosystem. It's designed to monitor...
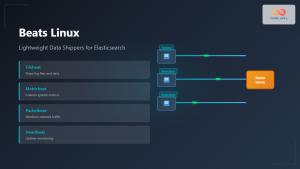
Beats Linux: Complete Guide to Data Shippers for Elasticsearch Integration
Beats are lightweight, open-source data shippers developed by Elastic that collect different types of data from your systems and forward...

elasticsearch Linux: Complete Guide to Search and Analytics Engine Installation and Usage
Elasticsearch is a powerful, distributed search and analytics engine built on Apache Lucene that enables real-time search, analysis, and visualization...
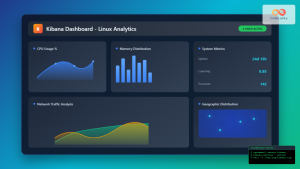
Kibana Linux: Complete Guide to Data Visualization Dashboard Setup and Management
Kibana is a powerful open-source data visualization and exploration tool that works seamlessly with Elasticsearch to provide interactive dashboards and...
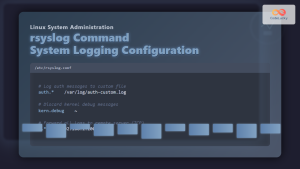
rsyslog Command Linux: System Logging Configuration with Examples
rsyslog is one of the most powerful and widely used system logging tools in Linux. It stands for “rocket-fast syslog”...
Winlogbeat Linux: Complete Guide to Shipping Windows Event Logs
Winlogbeat is a lightweight shipper designed to forward Windows Event Logs to Elasticsearch or Logstash. While it primarily runs on...
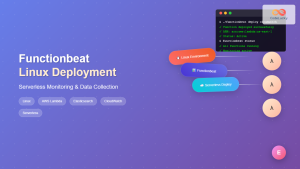
Functionbeat Linux: Complete Guide to Serverless Deployment and Monitoring
Functionbeat represents a revolutionary approach to serverless monitoring and data collection in modern cloud environments. As part of the Elastic...
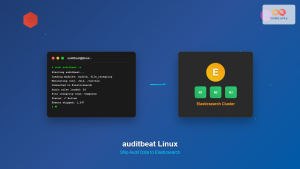
auditbeat Linux: Complete Guide to Shipping Audit Data to Elasticsearch
Introduction to auditbeat auditbeat is a lightweight shipper from the Elastic Beat family that collects audit data from the Linux...
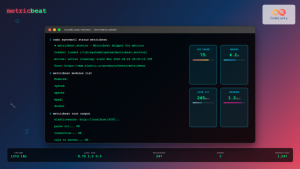
metricbeat Linux: Complete Guide to System and Service Metrics Monitoring
Metricbeat is a lightweight shipper that helps you monitor your systems and services by collecting metrics from the operating system...
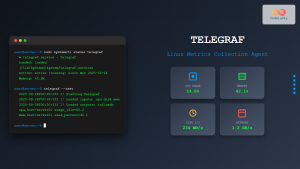
Telegraf Linux: Complete Guide to Installing and Configuring the Metrics Collection Agent
Telegraf is a powerful, plugin-driven server agent for collecting and reporting metrics from databases, systems, and IoT sensors. As part...
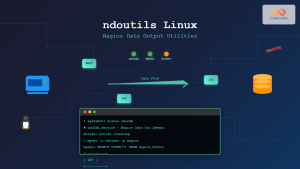
ndoutils Linux: Complete Guide to Nagios Data Output Utilities
The Nagios Data Output Utilities (ndoutils) serve as a crucial bridge between your Nagios monitoring system and database storage, enabling...
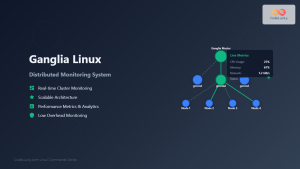
ganglia Linux: Complete Guide to Distributed Monitoring System
Ganglia is a powerful, open-source distributed monitoring system designed specifically for high-performance computing clusters, grids, and cloud infrastructures. Originally developed...