Understanding server activity through log file analysis is essential in maintaining, troubleshooting, and optimizing server performance. Logs contain detailed records of server events, user interactions, and system errors. This article provides a comprehensive guide on how to analyze log files effectively with practical examples, visual explanations, and interactive insights, empowering developers and system admins to decode server behavior.
What Are Server Log Files?
Server log files are text files that record events happening within a server. These logs capture data such as:
- Requests made to the server
- Status codes of responses (success, errors)
- Timestamps of activities
- IP addresses accessing the server
- Resource utilization
Common server logs include access.log and error.log. They help track both routine and anomalous activity on a server.
Why Log File Analysis Matters
Analyzing log files helps in:
- Identifying security breaches and suspicious activity
- Diagnosing server errors and downtime causes
- Monitoring traffic patterns and user behavior
- Optimizing server performance and resource allocation
- Auditing compliance and operational standards
Tools and Techniques for Log Analysis
Manual log review can be tedious. Using command-line tools like grep, awk, sed, and utilities like tail to monitor logs in real-time is common. For more structured analysis, tools like ELK Stack (Elasticsearch, Logstash, Kibana), Splunk, or Graylog are used.
Basic Command-Line Examples
Example 1: Searching for errors in Apache error log
grep "error" /var/log/apache2/error.logThis command filters lines containing the word “error”.
Example 2: Monitoring access logs in real time
tail -f /var/log/apache2/access.logThis continuously displays new log entries as they arrive, excellent for live troubleshooting.
Log File Structure Explained
Logs generally follow a predefined format. For example, a typical Apache access log entry:
127.0.0.1 - frank [10/Oct/2021:13:55:36 -0700] "GET /apache_pb.gif HTTP/1.0" 200 2326Breakdown:
127.0.0.1: Client IP address-: Identity of the client (rarely used)frank: Username (if authenticated)[10/Oct/2021:13:55:36 -0700]: Timestamp"GET /apache_pb.gif HTTP/1.0": HTTP method, requested resource, and protocol200: HTTP status code2326: Size of the object returned to client (bytes)
Step-by-Step Log File Analysis Workflow
Following a structured approach helps in comprehensive log analysis:
- Identify the log file: Know where your logs are stored and their type.
- Define the goal: Are you looking for downtime causes, security issues, or performance metrics?
- Filter relevant data: Use keywords, time ranges, or status codes to reduce noise.
- Interpret entries: Understand what each piece of information means contextually.
- Visualize or summarize: Use charts or summaries to spot trends.
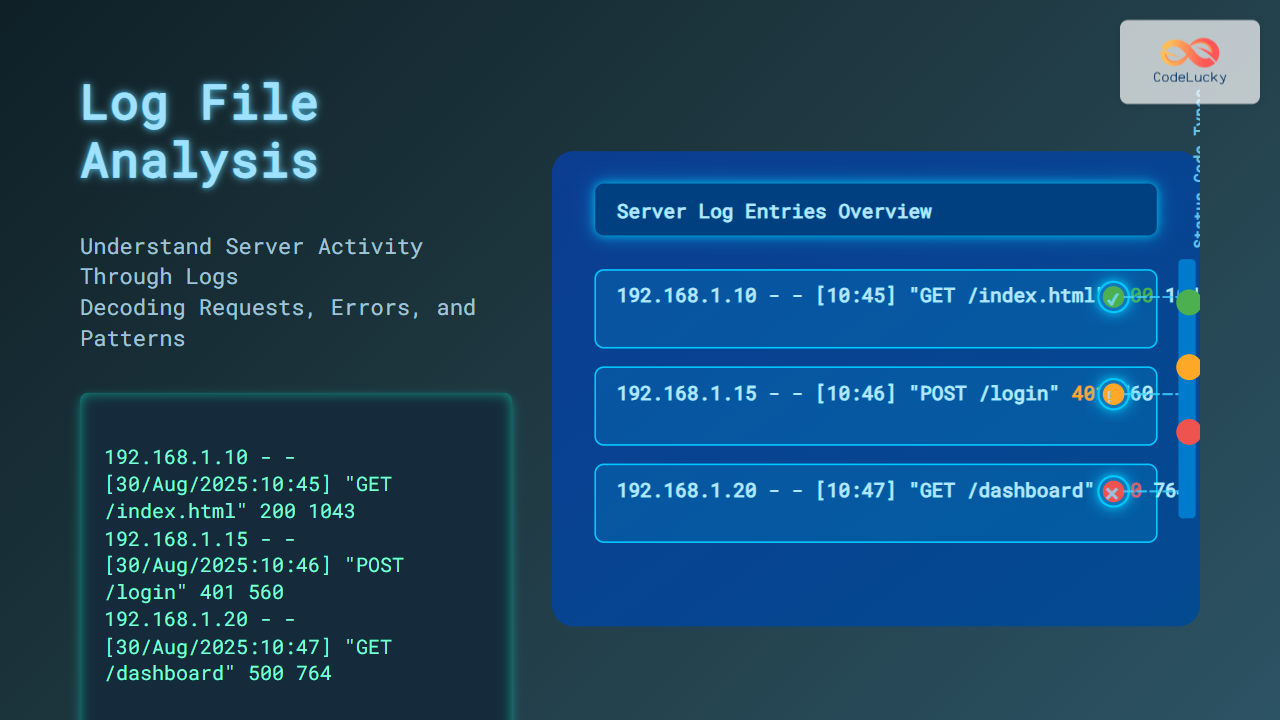
Analyzing Sample Apache Access Log Entries
Consider these sample entries:
192.168.1.10 - - [30/Aug/2025:10:45:01 +0000] "GET /index.html HTTP/1.1" 200 1043
192.168.1.15 - - [30/Aug/2025:10:46:12 +0000] "POST /login HTTP/1.1" 401 560
192.168.1.20 - - [30/Aug/2025:10:47:30 +0000] "GET /dashboard HTTP/1.1" 500 764
- The first request succeeded with status
200. - The second request failed login with status
401 Unauthorized. - The third request resulted in a server error
500.
Example: Filtering Errors
grep " 5" access.logThis filters all 5xx server error codes from the log.
Interactive Parsing Example Using Python
Here’s a simple Python snippet to parse Apache logs and summarize status codes:
import re
from collections import Counter

log_data = """
192.168.1.10 - - [30/Aug/2025:10:45:01 +0000] "GET /index.html HTTP/1.1" 200 1043
192.168.1.15 - - [30/Aug/2025:10:46:12 +0000] "POST /login HTTP/1.1" 401 560
192.168.1.20 - - [30/Aug/2025:10:47:30 +0000] "GET /dashboard HTTP/1.1" 500 764
"""

pattern = r'\" \d{3} '
statuses = re.findall(pattern, log_data)
status_codes = [s.strip().replace('" ', '') for s in statuses]

count = Counter(status_codes)
for code, freq in count.items():
    print(f"Status {code}: {freq} occurrence(s)")
Output:
Status 200: 1 occurrence(s)
Status 401: 1 occurrence(s)
Status 500: 1 occurrence(s)
Visualizing Log Insights With Mermaid
Mermaid diagrams can help visualize workflow or alert states during log analysis.
Best Practices for Effective Log Analysis
- Automate: Use log management tools to automate collection and parsing.
- Centralize Logs: Aggregate logs from multiple servers in one place.
- Set Alerts: Configure alerts for critical error codes or suspicious patterns.
- Rotate Logs: Regularly archive old logs to maintain performance.
- Secure Logs: Protect log files from unauthorized changes.
Summary
Log file analysis is a powerful skill for understanding server activity, detecting problems early, and enforcing security. By mastering log formats, command-line techniques, parsing scripts, and visualization tools, one gains deep insight into server operations. Practical examples and Mermaid visualizations aid comprehension and make log analysis approachable for developers and system administrators alike.


