What is Live System Analysis?
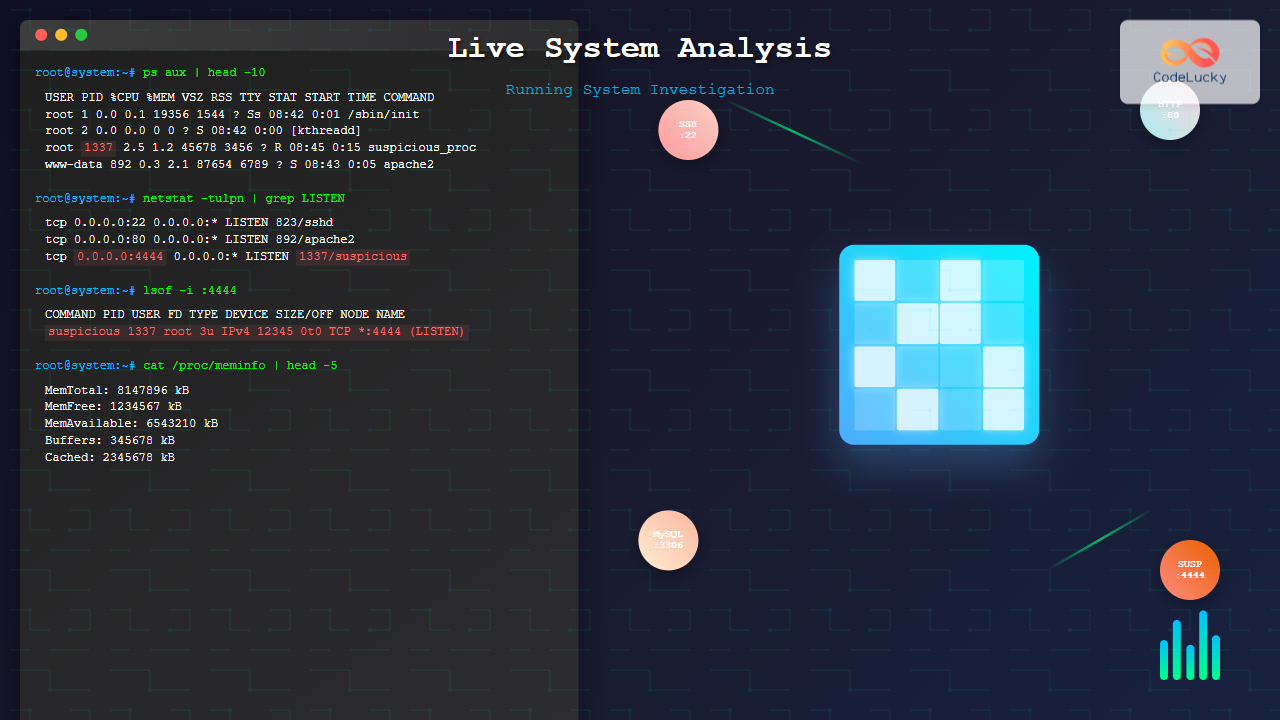
Live system analysis refers to the process of investigating and examining a computer system while it is actively running, without shutting it down or altering its current state. This technique is crucial in incident response, forensic investigations, and system troubleshooting where preserving the volatile data and maintaining system continuity is essential.
Unlike traditional forensic analysis that works on static disk images, live analysis captures dynamic information such as running processes, active network connections, loaded modules, and memory contents that would be lost upon system shutdown.
Core Components of Live System Analysis
Process Analysis and Monitoring
Process analysis forms the backbone of live system investigation. It involves examining running processes, their relationships, resource usage, and behavioral patterns.
Windows Process Investigation
On Windows systems, several tools provide comprehensive process analysis capabilities:
# List all running processes with detailed information
tasklist /v

# Display processes in tree format showing parent-child relationships
tasklist /tree

# Show processes with their associated services
tasklist /svc

# Monitor process creation in real-time
wmic process list full /format:list
Example Output Analysis:
Image Name                     PID Session Name        Session#    Mem Usage
========================= ======== ================ =========== ============
System Idle Process              0 Services                   0          8 K
System                           4 Services                   0        284 K
smss.exe                       372 Services                   0      1,036 K
csrss.exe                      496 Services                   0      4,168 K
winlogon.exe                   520 Services                   0      3,312 K
services.exe                   564 Services                   0      4,840 K
lsass.exe                      576 Services                   0      8,364 K
Linux Process Investigation
Linux provides powerful command-line tools for process analysis:
# Display detailed process information
ps aux

# Show process tree with relationships
pstree -p

# Monitor processes in real-time
top -p $(pgrep -d',' process_name)

# Examine specific process details
cat /proc/PID/status
cat /proc/PID/cmdline
cat /proc/PID/environ
Example Process Tree Analysis:
systemd(1)─┬─NetworkManager(825)─┬─dhclient(1337)
           ├─accounts-daemon(823)───{accounts-daemon}(834)
           ├─atd(1298)
           ├─cron(1287)
           ├─dbus(824)
           ├─systemd-logind(827)
           └─sshd(1289)───sshd(2445)───bash(2446)───pstree(2501)
Memory Analysis Techniques
Memory analysis involves examining the contents of system RAM to identify malicious code, extract artifacts, and understand system behavior.
Windows Memory Analysis
Windows memory analysis can be performed using various tools and techniques:
# Create memory dump using built-in tools
wmic process where name="process.exe" call create "cmd.exe /c taskmgr.exe"

# Using ProcDump for specific process
procdump -ma process_id output_file.dmp

# Examine process memory using PowerShell
Get-Process | Select-Object ProcessName, Id, WorkingSet, VirtualMemorySize
Linux Memory Analysis
# Examine process memory maps
cat /proc/PID/maps

# Dump process memory
gcore PID

# Analyze memory usage patterns
cat /proc/meminfo
cat /proc/PID/status | grep -E 'Vm|Rss'

# Extract strings from process memory
strings /proc/PID/mem
Network Activity Investigation
Network analysis reveals active connections, communication patterns, and potential security threats in real-time.
Connection Monitoring
Windows Network Analysis:
# Display active network connections
netstat -an

# Show connections with process IDs
netstat -ano

# Monitor network activity in real-time
netstat -an 1

# Display routing table
route print
Linux Network Analysis:
# Display active connections
ss -tuln

# Show connections with process information
ss -tulpn

# Monitor network interfaces
nethogs

# Capture network traffic
tcpdump -i interface_name

# Display network statistics
cat /proc/net/dev
Example Network Investigation Output
Proto Recv-Q Send-Q Local Address           Foreign Address         State       PID/Program
tcp        0      0 0.0.0.0:22             0.0.0.0:*               LISTEN      1289/sshd
tcp        0      0 127.0.0.1:631          0.0.0.0:*               LISTEN      1456/cupsd
tcp        0     52 192.168.1.100:22      192.168.1.50:54832     ESTABLISHED 2445/sshd
tcp6       0      0 :::80                  :::*                    LISTEN      2134/apache2
Advanced Live Analysis Techniques
Registry and Configuration Analysis
System configuration and registry analysis provides insights into system behavior, installed software, and potential modifications.
# Query specific registry keys
reg query "HKLM\SOFTWARE\Microsoft\Windows\CurrentVersion\Run"

# Export registry branch
reg export "HKLM\SYSTEM\CurrentControlSet\Services" services.reg

# Monitor registry changes in real-time
procmon.exe (Process Monitor)
File System Activity Monitoring
Monitoring file system activity helps identify suspicious file operations and data access patterns.
Windows File Monitoring
# Monitor file access using sysmon
sysmon -accepteula -i sysmonconfig.xml

# View file access events
wevtutil qe Microsoft-Windows-Sysmon/Operational /f:text
Linux File Monitoring
# Monitor file system events
inotifywait -mr /path/to/monitor

# Track file access with auditd
auditctl -w /etc/passwd -p wa

# View audit logs
ausearch -f /etc/passwd
Volatile Data Collection Strategies
Volatile data collection must be performed systematically to preserve evidence integrity while maintaining system functionality.
Order of Volatility
Data collection should follow the order of volatility principle, collecting the most volatile data first:
- CPU registers and cache
- System memory (RAM)
- Network connections and routing tables
- Running processes and services
- System uptime and logged users
- Open files and temporary data
Automated Collection Scripts
Windows PowerShell Collection Script:
# Comprehensive live system data collection
$timestamp = Get-Date -Format "yyyyMMdd_HHmmss"
$outputDir = "C:\Investigation_$timestamp"
New-Item -ItemType Directory -Path $outputDir

# Collect system information
Get-ComputerInfo | Out-File "$outputDir\system_info.txt"
Get-Process | Out-File "$outputDir\processes.txt"
Get-Service | Out-File "$outputDir\services.txt"
netstat -ano | Out-File "$outputDir\network_connections.txt"

# Collect user and authentication data
Get-LocalUser | Out-File "$outputDir\local_users.txt"
Get-EventLog -LogName Security -Newest 1000 | Out-File "$outputDir\security_events.txt"
Linux Bash Collection Script:
#!/bin/bash
TIMESTAMP=$(date +%Y%m%d_%H%M%S)
OUTPUT_DIR="/tmp/investigation_$TIMESTAMP"
mkdir -p $OUTPUT_DIR

# System information collection
uname -a > $OUTPUT_DIR/system_info.txt
ps aux > $OUTPUT_DIR/processes.txt
ss -tulpn > $OUTPUT_DIR/network_connections.txt
lsof > $OUTPUT_DIR/open_files.txt

# Memory and kernel information
cat /proc/meminfo > $OUTPUT_DIR/memory_info.txt
cat /proc/version > $OUTPUT_DIR/kernel_version.txt
dmesg > $OUTPUT_DIR/kernel_messages.txt
Practical Investigation Scenarios
Malware Detection and Analysis
Live system analysis is particularly effective for detecting active malware infections:
# Identify suspicious processes
tasklist | findstr /i "unusual_process_name"

# Check process file locations
wmic process get name,processid,executablepath

# Examine process network connections
netstat -ano | findstr PID
Performance Issue Investigation
Diagnosing performance problems requires real-time monitoring:
# Monitor CPU usage by process
top -o %CPU

# Track memory consumption
watch -n 1 'cat /proc/meminfo | head -5'

# Identify I/O bottlenecks
iotop -o
Best Practices and Considerations
Legal and Ethical Considerations
Live system analysis must be conducted within proper legal frameworks:
- Authorization: Ensure proper authorization before conducting analysis
- Chain of custody: Maintain detailed logs of all actions performed
- Minimal impact: Avoid altering system state during investigation
- Documentation: Record all commands and observations thoroughly
Technical Best Practices
Follow these guidelines for effective live analysis:
- Use read-only tools: Minimize system modifications during analysis
- Remote analysis: Conduct analysis from external systems when possible
- Preserve evidence: Create copies of volatile data immediately
- Systematic approach: Follow documented procedures consistently
Tools and Frameworks
Commercial Tools
- Volatility Framework: Advanced memory analysis platform
- EnCase Enterprise: Comprehensive forensic investigation suite
- X-Ways Forensics: Professional computer forensics software
- SANS SIFT: Open-source forensic analysis distribution
Open Source Alternatives
- YARA: Pattern matching engine for malware detection
- Autopsy: Digital forensics platform with live analysis capabilities
- Rekall: Advanced memory analysis framework
- OSQuery: SQL-based operating system instrumentation
Future Trends in Live System Analysis
The field of live system analysis continues to evolve with emerging technologies:
- AI-powered analysis: Machine learning algorithms for anomaly detection
- Cloud-based investigation: Remote analysis of cloud infrastructure
- Container forensics: Analysis of containerized environments
- IoT device investigation: Live analysis of Internet of Things devices
Live system analysis represents a critical skill set for modern system administrators, security professionals, and forensic investigators. By maintaining system integrity while extracting crucial volatile information, practitioners can effectively respond to incidents, troubleshoot problems, and conduct thorough investigations without disrupting critical operations.
The techniques and methodologies outlined in this guide provide a comprehensive foundation for conducting effective live system analysis across various platforms and scenarios. Regular practice and staying updated with emerging tools and techniques will enhance your capabilities in this rapidly evolving field.

