InfluxDB is a powerful open-source time series database designed to handle high write and query loads for applications involving time-stamped data. It’s particularly popular for monitoring, analytics, and IoT applications where you need to store and analyze large volumes of time-indexed data efficiently.
What is InfluxDB?
InfluxDB is purpose-built for time series data, offering exceptional performance for storing metrics, events, and analytics. Unlike traditional relational databases, InfluxDB is optimized for time-based queries and can handle millions of data points per second with minimal resource consumption.
Key Features
- High Performance: Optimized for time series workloads with fast ingestion and queries
- SQL-like Query Language: Uses Flux and InfluxQL for intuitive data querying
- Schemaless Design: No need to define schemas upfront
- Built-in HTTP API: RESTful interface for easy integration
- Compression: Automatic data compression to minimize storage
- Retention Policies: Automatic data expiration and downsampling
Installing InfluxDB on Linux
Method 1: Using Package Manager (Ubuntu/Debian)
First, add the InfluxData repository and install InfluxDB:
# Add the InfluxData repository key
curl -sL https://repos.influxdata.com/influxdb.key | sudo apt-key add -

# Add the repository
echo "deb https://repos.influxdata.com/ubuntu $(lsb_release -cs) stable" | sudo tee /etc/apt/sources.list.d/influxdb.list

# Update package list and install
sudo apt update
sudo apt install influxdb
Method 2: Using Package Manager (CentOS/RHEL)
# Add the InfluxData repository
cat <
Method 3: Manual Installation
# Download the latest InfluxDB package
wget https://dl.influxdata.com/influxdb/releases/influxdb_1.8.10_amd64.deb

# Install the package
sudo dpkg -i influxdb_1.8.10_amd64.deb

# For RPM-based systems
# wget https://dl.influxdata.com/influxdb/releases/influxdb-1.8.10.x86_64.rpm
# sudo rpm -ivh influxdb-1.8.10.x86_64.rpm
Starting and Managing InfluxDB Service
Service Management Commands
# Start InfluxDB service
sudo systemctl start influxdb

# Enable InfluxDB to start on boot
sudo systemctl enable influxdb

# Check service status
sudo systemctl status influxdb

# Stop the service
sudo systemctl stop influxdb

# Restart the service
sudo systemctl restart influxdb
Expected Output:
● influxdb.service - InfluxDB is an open-source, distributed, time series database
   Loaded: loaded (/lib/systemd/system/influxdb.service; enabled; vendor preset: enabled)
   Active: active (running) since Tue 2024-01-15 10:30:25 UTC; 2min 15s ago
     Docs: https://docs.influxdata.com/influxdb/
 Main PID: 12345 (influxd)
    Tasks: 15 (limit: 4915)
   CGroup: /system.slice/influxdb.service
           └─12345 /usr/bin/influxd -config /etc/influxdb/influxdb.conf
InfluxDB Configuration
Main Configuration File
The primary configuration file is located at /etc/influxdb/influxdb.conf:
# View current configuration
sudo cat /etc/influxdb/influxdb.conf

# Edit configuration
sudo nano /etc/influxdb/influxdb.conf
Key Configuration Sections
# HTTP endpoint configuration
[http]
  enabled = true
  bind-address = ":8086"
  auth-enabled = false
  log-enabled = true

# Data directory and engine settings
[data]
  dir = "/var/lib/influxdb/data"
  wal-dir = "/var/lib/influxdb/wal"
  max-series-per-database = 1000000

# Retention policy settings
[retention]
  enabled = true
  check-interval = "30m"
Using InfluxDB Command Line Interface
Connecting to InfluxDB
# Start the InfluxDB CLI
influx

# Connect to specific host and port
influx -host localhost -port 8086

# Connect with authentication
influx -username myuser -password mypassword
Expected Output:
Connected to http://localhost:8086 version 1.8.10
InfluxDB shell version: 1.8.10
>
Basic Database Operations
# Show all databases
SHOW DATABASES

# Create a new database
CREATE DATABASE mydb

# Use a database
USE mydb

# Show measurements (tables)
SHOW MEASUREMENTS

# Show series
SHOW SERIES

# Drop a database
DROP DATABASE mydb
Expected Output for SHOW DATABASES:
name: databases
name
----
_internal
mydb
telegraf
Writing Data to InfluxDB
Using Line Protocol
InfluxDB uses line protocol for writing data. The format is:
measurement,tag1=value1,tag2=value2 field1=value1,field2=value2 timestamp
# Insert single data point
INSERT temperature,location=office,sensor=A value=23.5

# Insert data with timestamp (nanoseconds)
INSERT temperature,location=office,sensor=A value=24.1 1642248000000000000

# Insert multiple fields
INSERT weather,location=office temperature=23.5,humidity=45.2,pressure=1013.25
Using HTTP API
# Write data using curl
curl -i -XPOST 'http://localhost:8086/write?db=mydb' \
--data-binary 'temperature,location=office,sensor=A value=25.3'

# Write multiple points
curl -i -XPOST 'http://localhost:8086/write?db=mydb' \
--data-binary 'temperature,location=office value=25.3
humidity,location=office value=60.2
pressure,location=office value=1012.5'
Querying Data from InfluxDB
Basic SELECT Queries
# Select all data from a measurement
SELECT * FROM temperature

# Select specific fields
SELECT location, value FROM temperature

# Select with time range
SELECT * FROM temperature WHERE time >= '2024-01-01' AND time <= '2024-01-02'

# Select with tag filters
SELECT * FROM temperature WHERE location='office'

# Limit results
SELECT * FROM temperature LIMIT 10
Expected Query Output:
name: temperature
time                location sensor value
----                -------- ------ -----
2024-01-15T10:30:00Z office   A      23.5
2024-01-15T10:31:00Z office   A      24.1
2024-01-15T10:32:00Z office   B      22.8
Aggregation Functions
# Calculate average
SELECT MEAN(value) FROM temperature WHERE time >= now() - 1h

# Calculate sum
SELECT SUM(value) FROM temperature WHERE time >= now() - 1h

# Calculate min and max
SELECT MIN(value), MAX(value) FROM temperature WHERE time >= now() - 1h

# Count data points
SELECT COUNT(value) FROM temperature WHERE time >= now() - 1h
Grouping and Time-based Queries
# Group by time intervals
SELECT MEAN(value) FROM temperature WHERE time >= now() - 1h GROUP BY time(10m)

# Group by tags
SELECT MEAN(value) FROM temperature WHERE time >= now() - 1h GROUP BY location

# Group by time and tags
SELECT MEAN(value) FROM temperature WHERE time >= now() - 1h GROUP BY time(5m), location
Retention Policies
Managing Data Retention
# Show retention policies
SHOW RETENTION POLICIES ON mydb

# Create retention policy
CREATE RETENTION POLICY "one_week" ON "mydb" DURATION 1w REPLICATION 1 DEFAULT

# Create retention policy with different duration
CREATE RETENTION POLICY "one_month" ON "mydb" DURATION 30d REPLICATION 1

# Alter retention policy
ALTER RETENTION POLICY "one_week" ON "mydb" DURATION 2w

# Drop retention policy
DROP RETENTION POLICY "one_week" ON "mydb"
Expected Output:
name: mydb
name    duration shardGroupDuration replicaN default
----    -------- ------------------ -------- -------
autogen 0s       168h0m0s           1        false
one_week 168h0m0s 24h0m0s           1        true
Continuous Queries
Creating Automated Aggregations
# Create continuous query for hourly averages
CREATE CONTINUOUS QUERY "hourly_avg" ON "mydb"
BEGIN
  SELECT MEAN(value) AS avg_temp
  INTO "average_temp"
  FROM "temperature"
  GROUP BY time(1h), location
END

# Show continuous queries
SHOW CONTINUOUS QUERIES

# Drop continuous query
DROP CONTINUOUS QUERY "hourly_avg" ON "mydb"
User Management and Security
Creating Users and Managing Permissions
# Create admin user
CREATE USER admin WITH PASSWORD 'strongpassword' WITH ALL PRIVILEGES

# Create regular user
CREATE USER reader WITH PASSWORD 'password'

# Grant database permissions
GRANT READ ON mydb TO reader
GRANT WRITE ON mydb TO writer
GRANT ALL ON mydb TO dbadmin

# Show users
SHOW USERS

# Drop user
DROP USER reader
Enabling Authentication
Edit the configuration file to enable authentication:
# Edit configuration
sudo nano /etc/influxdb/influxdb.conf

# Add or modify the http section
[http]
  auth-enabled = true

# Restart InfluxDB
sudo systemctl restart influxdb
Monitoring InfluxDB Performance
Internal Statistics
# Show statistics
SHOW STATS

# Show specific stats module
SHOW STATS FOR 'runtime'

# Query internal measurements
SELECT * FROM "_internal"."monitor"."runtime" WHERE time >= now() - 1h
Performance Monitoring Queries
# Check database sizes
SELECT * FROM "_internal"."monitor"."database" WHERE time >= now() - 5m

# Monitor query performance
SELECT * FROM "_internal"."monitor"."queryExecutor" WHERE time >= now() - 5m

# Check memory usage
SELECT * FROM "_internal"."monitor"."runtime" WHERE time >= now() - 5m
Backup and Restore
Creating Backups
# Backup entire database
influxd backup -portable /path/to/backup/directory

# Backup specific database
influxd backup -portable -database mydb /path/to/backup/directory

# Backup with time range
influxd backup -portable -database mydb -start 2024-01-01T00:00:00Z -end 2024-01-02T00:00:00Z /path/to/backup/directory
Restoring from Backup
# Restore entire backup
influxd restore -portable /path/to/backup/directory

# Restore specific database
influxd restore -portable -database mydb /path/to/backup/directory

# Restore to different database name
influxd restore -portable -database mydb -newdb restored_db /path/to/backup/directory
Integration Examples
Using Python Client
# Install Python client
pip install influxdb-client

# Python script example
from influxdb_client import InfluxDBClient, Point
from influxdb_client.client.write_api import SYNCHRONOUS

# Initialize client
client = InfluxDBClient(url="http://localhost:8086", token="", org="")
write_api = client.write_api(write_options=SYNCHRONOUS)
query_api = client.query_api()

# Write data
point = Point("temperature").tag("location", "office").field("value", 25.3)
write_api.write(bucket="mydb", record=point)

# Query data
query = 'from(bucket: "mydb") |> range(start: -1h)'
result = query_api.query(query)
Shell Script Integration
#!/bin/bash
# Script to collect system metrics and send to InfluxDB

while true; do
    # Get CPU usage
    cpu_usage=$(top -bn1 | grep "Cpu(s)" | awk '{print $2}' | cut -d'%' -f1)

    # Get memory usage
    mem_usage=$(free | grep Mem | awk '{printf "%.2f", $3/$2 * 100.0}')

    # Send to InfluxDB
    curl -i -XPOST 'http://localhost:8086/write?db=system_metrics' \
    --data-binary "cpu_usage value=$cpu_usage
    memory_usage value=$mem_usage"

    sleep 60
done
Troubleshooting Common Issues
Service Won’t Start
# Check logs
sudo journalctl -u influxdb -f

# Check configuration syntax
influxd config

# Verify file permissions
sudo chown -R influxdb:influxdb /var/lib/influxdb/
Connection Issues
# Test HTTP endpoint
curl -i 'http://localhost:8086/ping'

# Check if port is listening
netstat -tlnp | grep 8086

# Test with different host
influx -host 127.0.0.1 -port 8086
Performance Issues
# Check disk space
df -h /var/lib/influxdb/

# Monitor system resources
top -p $(pgrep influxd)

# Check for large series cardinality
SHOW SERIES CARDINALITY ON mydb
Best Practices
Schema Design
- Use tags wisely: Tags are indexed but have cardinality limits
- Batch writes: Group multiple points in single requests
- Avoid high cardinality: Don’t use unique identifiers as tags
- Use appropriate data types: Choose fields over tags for numerical data
Performance Optimization
# Optimize query performance with time ranges
SELECT * FROM measurement WHERE time >= now() - 1h

# Use appropriate GROUP BY intervals
SELECT MEAN(value) FROM measurement
WHERE time >= now() - 1d GROUP BY time(5m)

# Batch write operations
curl -i -XPOST 'http://localhost:8086/write?db=mydb' \
--data-binary @data_file.txt
Advanced Features
Flux Query Language
# Basic Flux query
from(bucket: "mydb")
  |> range(start: -1h)
  |> filter(fn: (r) => r._measurement == "temperature")
  |> mean()

# Complex aggregation with Flux
from(bucket: "mydb")
  |> range(start: -24h)
  |> filter(fn: (r) => r._measurement == "temperature")
  |> aggregateWindow(every: 1h, fn: mean)
  |> yield(name: "hourly_average")
InfluxDB provides a robust foundation for time series data management on Linux systems. Its combination of high performance, flexible querying, and comprehensive tooling makes it an excellent choice for monitoring, IoT applications, and analytics workloads. Regular maintenance, proper configuration, and following best practices will ensure optimal performance and reliability for your time series database needs.
Related Posts
Telegraf Linux: Complete Guide to Installing and Configuring the Metrics Collection Agent
Telegraf is a powerful, plugin-driven server agent for collecting and reporting metrics from databases, systems, and IoT sensors. As part...
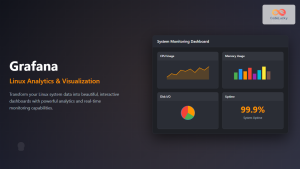
grafana Linux: Complete Guide to Analytics and Interactive Visualization Platform
Grafana has revolutionized the way organizations visualize and analyze their data on Linux systems. This powerful open-source analytics and interactive...

Prometheus Linux: Complete Monitoring and Alerting Toolkit Guide
Prometheus has revolutionized the way we monitor and alert on modern infrastructure. As an open-source monitoring toolkit originally built at...
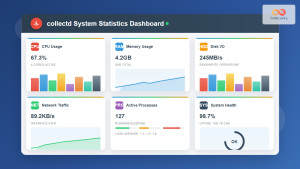
collectd Linux: Complete Guide to System Statistics Collection Daemon
The collectd daemon is a powerful system statistics collection tool for Linux that gathers performance metrics from various system components...

elasticsearch Linux: Complete Guide to Search and Analytics Engine Installation and Usage
Elasticsearch is a powerful, distributed search and analytics engine built on Apache Lucene that enables real-time search, analysis, and visualization...
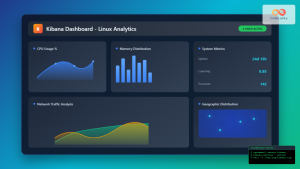
Kibana Linux: Complete Guide to Data Visualization Dashboard Setup and Management
Kibana is a powerful open-source data visualization and exploration tool that works seamlessly with Elasticsearch to provide interactive dashboards and...
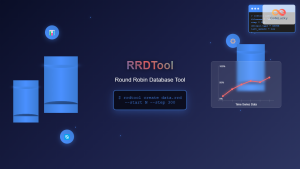
rrdtool Command Linux: Complete Guide to Round Robin Database Tool
The rrdtool (Round Robin Database Tool) is a powerful Linux command-line utility designed for storing and displaying time-series data in...
Munin Linux: Complete Guide to Network Resource Monitoring and Performance Analysis
Munin is a powerful networked resource monitoring tool for Linux systems that provides comprehensive insights into system performance, resource utilization,...
Cacti Advanced Linux: Complete Guide to Enterprise Network Graphing and Monitoring
Cacti stands as one of the most powerful open-source network graphing solutions available for Linux systems, providing comprehensive network monitoring...
ganglia Linux: Complete Guide to Distributed Monitoring System
Ganglia is a powerful, open-source distributed monitoring system designed specifically for high-performance computing clusters, grids, and cloud infrastructures. Originally developed...

Redis Linux: Complete Guide to In-Memory Data Structure Store Installation and Commands
Redis (Remote Dictionary Server) is a powerful, open-source, in-memory data structure store that functions as a database, cache, and message...

MySQL Date Functions: Master Date Manipulation
Date and time are crucial aspects of almost every database application. Whether you are scheduling events, tracking user activity, or...