Filebeat is a lightweight log shipper that belongs to the Elastic Stack (formerly ELK Stack) ecosystem. It’s designed to monitor log files on your Linux systems and forward them to Elasticsearch for indexing and analysis. This comprehensive guide will walk you through everything you need to know about using Filebeat on Linux systems.
What is Filebeat?
Filebeat is a data shipper that sits on your servers as an agent, monitoring the log directories or specific log files you specify. When Filebeat detects changes to these files, it harvests the log lines and forwards them to Elasticsearch or other outputs like Logstash, Redis, or Kafka.
Key Features of Filebeat
- Lightweight: Minimal resource consumption with efficient log shipping
- Reliable: Guarantees at-least-once delivery with built-in backpressure handling
- Secure: Supports TLS encryption and authentication
- Resilient: Handles network failures gracefully with automatic reconnection
- Modular: Includes pre-built modules for popular services like Apache, Nginx, MySQL
Installing Filebeat on Linux
Let’s start by installing Filebeat on various Linux distributions:
Ubuntu/Debian Installation
First, add the Elastic repository and install Filebeat:
# Add Elastic's signing key
wget -qO - https://artifacts.elastic.co/GPG-KEY-elasticsearch | sudo apt-key add -

# Add the repository
echo "deb https://artifacts.elastic.co/packages/8.x/apt stable main" | sudo tee /etc/apt/sources.list.d/elastic-8.x.list

# Update package index and install
sudo apt update
sudo apt install filebeat
CentOS/RHEL/Fedora Installation
For RPM-based distributions:
# Import Elastic's signing key
sudo rpm --import https://artifacts.elastic.co/GPG-KEY-elasticsearch

# Create repository file
sudo tee /etc/yum.repos.d/elastic.repo << 'EOF'
[elastic-8.x]
name=Elastic repository for 8.x packages
baseurl=https://artifacts.elastic.co/packages/8.x/yum
gpgcheck=1
gpgkey=https://artifacts.elastic.co/GPG-KEY-elasticsearch
enabled=1
autorefresh=1
type=rpm-md
EOF

# Install Filebeat
sudo yum install filebeat
Direct Download Method
You can also download and install Filebeat directly:
# Download Filebeat
curl -L -O https://artifacts.elastic.co/downloads/beats/filebeat/filebeat-8.11.0-linux-x86_64.tar.gz

# Extract the archive
tar xzvf filebeat-8.11.0-linux-x86_64.tar.gz

# Move to appropriate directory
sudo mv filebeat-8.11.0-linux-x86_64 /opt/filebeat
Basic Filebeat Configuration
The main configuration file for Filebeat is located at /etc/filebeat/filebeat.yml. Let’s examine a basic configuration:
Minimal Configuration Example
filebeat.inputs:
- type: log
  enabled: true
  paths:
    - /var/log/*.log
    - /var/log/messages
    - /var/log/syslog

output.elasticsearch:
  hosts: ["localhost:9200"]

processors:
  - add_host_metadata:
      when.not.contains.tags: forwarded

logging.level: info
logging.to_files: true
logging.files:
  path: /var/log/filebeat
  name: filebeat
  keepfiles: 7
  permissions: 0644
Understanding Configuration Sections
Filebeat Inputs: Define what log files to monitor
Output: Specify where to send the collected logs
Processors: Transform or enrich log data before shipping
Logging: Configure Filebeat’s own logging behavior
Advanced Configuration Examples
Multi-Path Log Collection
filebeat.inputs:
- type: log
  enabled: true
  paths:
    - /var/log/apache2/access.log
    - /var/log/apache2/error.log
  fields:
    service: apache
    environment: production
  fields_under_root: true
  multiline.pattern: '^[0-9]{4}-[0-9]{2}-[0-9]{2}'
  multiline.negate: true
  multiline.match: after

- type: log
  enabled: true
  paths:
    - /var/log/mysql/error.log
  fields:
    service: mysql
    environment: production
  fields_under_root: true
Elasticsearch Output with Authentication
output.elasticsearch:
  hosts: ["elasticsearch1:9200", "elasticsearch2:9200"]
  username: "filebeat_internal"
  password: "your_password"
  index: "filebeat-%{[agent.version]}-%{+yyyy.MM.dd}"
  template.settings:
    index.number_of_shards: 1
    index.codec: best_compression
Using Processors for Data Enhancement
processors:
  - add_host_metadata:
      when.not.contains.tags: forwarded
  - add_cloud_metadata: ~
  - add_docker_metadata: ~
  - drop_fields:
      fields: ["beat", "input", "source"]
  - rename:
      fields:
        - from: "message"
          to: "log_message"
  - timestamp:
      field: "@timestamp"
      layouts:
        - '2006-01-02T15:04:05.000Z'
        - '2006-01-02T15:04:05Z'
Working with Filebeat Modules
Filebeat modules provide a quick way to get started with common log formats. Let’s explore how to use them:
Listing Available Modules
sudo filebeat modules listSample Output:
Enabled:

Disabled:
apache
auditd
cisco
elasticsearch
envoyproxy
haproxy
icinga
iis
kafka
kibana
logstash
mongodb
mysql
nginx
osquery
postgresql
redis
suricata
system
traefik
Enabling Modules
Enable the system and nginx modules:
# Enable system module for system logs
sudo filebeat modules enable system

# Enable nginx module
sudo filebeat modules enable nginx

# Verify enabled modules
sudo filebeat modules list
Configuring Module Parameters
Edit module configuration files in /etc/filebeat/modules.d/:
# Edit nginx module configuration
sudo nano /etc/filebeat/modules.d/nginx.yml
Example nginx module configuration:
- module: nginx
  access:
    enabled: true
    var.paths: ["/var/log/nginx/access.log*"]
  error:
    enabled: true
    var.paths: ["/var/log/nginx/error.log*"]
Starting and Managing Filebeat Service
Using systemd (Most Modern Linux Distributions)
# Enable Filebeat to start on boot
sudo systemctl enable filebeat

# Start Filebeat service
sudo systemctl start filebeat

# Check service status
sudo systemctl status filebeat

# Stop Filebeat service
sudo systemctl stop filebeat

# Restart Filebeat service
sudo systemctl restart filebeat
Expected Status Output:
● filebeat.service - Filebeat sends log files to Logstash or directly to Elasticsearch
   Loaded: loaded (/usr/lib/systemd/system/filebeat.service; enabled; vendor preset: disabled)
   Active: active (running) since Tue 2025-08-26 09:36:15 IST; 2min 30s ago
     Docs: https://www.elastic.co/beats/filebeat
 Main PID: 12345 (filebeat)
   CGroup: /system.slice/filebeat.service
           └─12345 /usr/share/filebeat/bin/filebeat --environment systemd -c /etc/filebeat/filebeat.yml --path.home /usr/share/filebeat --path.config /etc/filebeat
Manual Execution for Testing
Run Filebeat in the foreground for debugging:
# Test configuration
sudo filebeat test config

# Test output connectivity
sudo filebeat test output

# Run in foreground with verbose logging
sudo filebeat -e -v
Monitoring and Troubleshooting
Checking Filebeat Logs
# View recent logs
sudo tail -f /var/log/filebeat/filebeat

# Check for errors
sudo grep -i error /var/log/filebeat/filebeat

# View logs with journalctl
sudo journalctl -u filebeat -f
Common Log Entries and Their Meanings
Successful Log Harvesting:
2025-08-26T09:36:15.123Z INFO [harvester] log/harvester.go:297 Harvester started for file: /var/log/syslogConnection to Elasticsearch:
2025-08-26T09:36:15.456Z INFO [elasticsearch] elasticsearch/client.go:757 Attempting to connect to Elasticsearch version 8.11.0Document Indexing:
2025-08-26T09:36:15.789Z INFO [publisher] pipeline/retry.go:219 retryer: send unwait signal to consumerPerformance Monitoring
Monitor Filebeat’s resource usage:
# Check memory and CPU usage
ps aux | grep filebeat

# Monitor file descriptors
sudo lsof -p $(pgrep filebeat)

# Check network connections
sudo netstat -tulpn | grep filebeat
Security Configuration
TLS/SSL Configuration
output.elasticsearch:
  hosts: ["https://elasticsearch:9200"]
  username: "filebeat_writer"
  password: "secure_password"
  ssl.certificate_authorities: ["/etc/ssl/certs/ca.crt"]
  ssl.certificate: "/etc/ssl/certs/filebeat.crt"
  ssl.key: "/etc/ssl/private/filebeat.key"
  ssl.verification_mode: full
API Key Authentication
output.elasticsearch:
  hosts: ["https://elasticsearch:9200"]
  api_key: "id:api_key_value"
  ssl.certificate_authorities: ["/etc/ssl/certs/ca.crt"]
Performance Optimization
Tuning Filebeat for High-Volume Logs
filebeat.inputs:
- type: log
  enabled: true
  paths:
    - /var/log/high-volume/*.log
  harvester_buffer_size: 32768
  max_bytes: 10485760
  scan_frequency: 1s
  close_inactive: 5m
  close_renamed: true
  close_removed: true
  clean_inactive: 72h

output.elasticsearch:
  hosts: ["elasticsearch1:9200", "elasticsearch2:9200"]
  worker: 4
  bulk_max_size: 3200
  flush_interval: 1s
  compression_level: 3
Memory and CPU Optimization
# Limit memory usage
filebeat.max_procs: 2

# Queue settings for better performance
queue.mem:
  events: 8192
  flush.min_events: 1024
  flush.timeout: 1s
Real-World Use Cases
Web Server Log Collection
filebeat.inputs:
- type: log
  enabled: true
  paths:
    - /var/log/nginx/access.log
  json.keys_under_root: true
  json.add_error_key: true
  fields:
    service: nginx
    log_type: access
  fields_under_root: true

- type: log
  enabled: true
  paths:
    - /var/log/nginx/error.log
  multiline.pattern: '^\d{4}/\d{2}/\d{2}'
  multiline.negate: true
  multiline.match: after
  fields:
    service: nginx
    log_type: error
  fields_under_root: true
Application Log Monitoring
filebeat.inputs:
- type: log
  enabled: true
  paths:
    - /opt/myapp/logs/*.log
  exclude_files: ['\.gz$']
  multiline.pattern: '^[0-9]{4}-[0-9]{2}-[0-9]{2}'
  multiline.negate: true
  multiline.match: after
  processors:
    - decode_json_fields:
        fields: ["message"]
        target: ""
        overwrite_keys: true
Integration with Logstash
Sometimes you might want to send logs to Logstash for additional processing:
output.logstash:
  hosts: ["logstash1:5044", "logstash2:5044"]
  loadbalance: true
  compression_level: 3
  ssl.certificate_authorities: ["/etc/ssl/certs/logstash-ca.crt"]
Backup and Recovery
Registry File Management
Filebeat maintains a registry of processed files:
# View registry location
sudo filebeat show config | grep path.data

# Backup registry
sudo cp /var/lib/filebeat/registry/filebeat/data.json /backup/filebeat-registry-backup.json

# Reset registry (use with caution)
sudo systemctl stop filebeat
sudo rm -f /var/lib/filebeat/registry/filebeat/data.json
sudo systemctl start filebeat
Best Practices
Configuration Management
- Version Control: Keep your Filebeat configurations in version control
- Environment-Specific Configs: Use separate configurations for different environments
- Template Usage: Use configuration templates for consistent deployments
- Regular Testing: Test configurations before deploying to production
Monitoring and Alerting
- Monitor Filebeat service health with system monitoring tools
- Set up alerts for Filebeat service failures
- Monitor log ingestion rates and identify bottlenecks
- Track registry file growth and clean up old entries
Security Considerations
- Use encrypted connections (TLS/SSL) for data transmission
- Implement proper authentication and authorization
- Regularly rotate API keys and passwords
- Limit file system permissions for Filebeat user
- Monitor for unauthorized configuration changes
Troubleshooting Common Issues
Filebeat Not Starting
Problem: Filebeat service fails to start
Solution:
# Check configuration syntax
sudo filebeat test config

# Check file permissions
sudo chown root:root /etc/filebeat/filebeat.yml
sudo chmod 600 /etc/filebeat/filebeat.yml

# Check service logs
sudo journalctl -u filebeat --no-pager
No Data in Elasticsearch
Problem: Logs are not appearing in Elasticsearch
Solution:
# Test Elasticsearch connectivity
sudo filebeat test output

# Check if logs are being harvested
sudo tail -f /var/log/filebeat/filebeat | grep harvester

# Verify log file permissions
ls -la /var/log/*.log
High Memory Usage
Problem: Filebeat consuming excessive memory
Solution:
# Reduce harvester buffer size
harvester_buffer_size: 16384

# Limit queue size
queue.mem:
  events: 4096

# Increase flush frequency
output.elasticsearch:
  flush_interval: 5s
Conclusion
Filebeat is a powerful and efficient tool for shipping log files from Linux systems to Elasticsearch. By following the configuration examples and best practices outlined in this guide, you can set up a robust log collection infrastructure that scales with your needs.
Remember to regularly monitor your Filebeat instances, keep configurations under version control, and implement proper security measures. With proper setup and maintenance, Filebeat will provide reliable log shipping capabilities for your observability and monitoring requirements.
The key to successful Filebeat deployment lies in understanding your log patterns, properly configuring inputs and outputs, and monitoring the system’s performance. Start with simple configurations and gradually add complexity as your requirements evolve.
Related Posts
auditbeat Linux: Complete Guide to Shipping Audit Data to Elasticsearch
Introduction to auditbeat auditbeat is a lightweight shipper from the Elastic Beat family that collects audit data from the Linux...
Beats Linux: Complete Guide to Data Shippers for Elasticsearch Integration
Beats are lightweight, open-source data shippers developed by Elastic that collect different types of data from your systems and forward...
Functionbeat Linux: Complete Guide to Serverless Deployment and Monitoring
Functionbeat represents a revolutionary approach to serverless monitoring and data collection in modern cloud environments. As part of the Elastic...
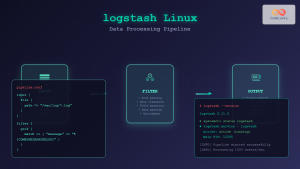
logstash Linux: Complete Guide to Data Processing Pipeline
What is Logstash? Logstash is a powerful, open-source data processing pipeline that ingests data from multiple sources simultaneously, transforms it,...
Winlogbeat Linux: Complete Guide to Shipping Windows Event Logs
Winlogbeat is a lightweight shipper designed to forward Windows Event Logs to Elasticsearch or Logstash. While it primarily runs on...

elasticsearch Linux: Complete Guide to Search and Analytics Engine Installation and Usage
Elasticsearch is a powerful, distributed search and analytics engine built on Apache Lucene that enables real-time search, analysis, and visualization...
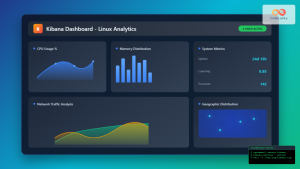
Kibana Linux: Complete Guide to Data Visualization Dashboard Setup and Management
Kibana is a powerful open-source data visualization and exploration tool that works seamlessly with Elasticsearch to provide interactive dashboards and...
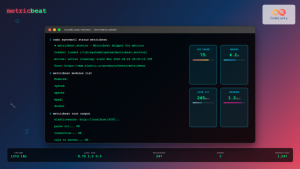
metricbeat Linux: Complete Guide to System and Service Metrics Monitoring
Metricbeat is a lightweight shipper that helps you monitor your systems and services by collecting metrics from the operating system...
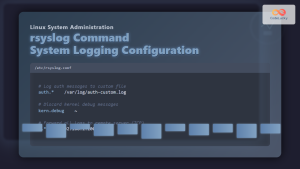
rsyslog Command Linux: System Logging Configuration with Examples
rsyslog is one of the most powerful and widely used system logging tools in Linux. It stands for “rocket-fast syslog”...
packetbeat Linux: Complete Network Packet Analysis Tool Guide
Network packet analysis is crucial for system administrators, security professionals, and developers who need to monitor, troubleshoot, and secure network...
Prometheus Linux: Complete Monitoring and Alerting Toolkit Guide
Prometheus has revolutionized the way we monitor and alert on modern infrastructure. As an open-source monitoring toolkit originally built at...
Log-structured File System: Sequential Write Optimization for High-Performance Storage
Log-structured File Systems (LFS) represent a revolutionary approach to data storage that fundamentally changes how operating systems handle file operations....