
The Excel CORREL function is a powerful statistical tool that calculates the correlation coefficient between two datasets, helping you understand the relationship between variables. Whether you’re analyzing sales data, conducting research, or performing financial analysis, mastering the CORREL function is essential for data-driven decision making.
What is the Excel CORREL Function?
The CORREL function returns the Pearson correlation coefficient, a statistical measure that determines the linear relationship between two sets of data. The result ranges from -1 to +1, where:
- +1 indicates a perfect positive correlation
- 0 indicates no linear correlation
- -1 indicates a perfect negative correlation
CORREL Function Syntax
The syntax for the CORREL function is straightforward:
=CORREL(array1, array2)
Parameters Explained
- array1 (Required): The first set of data values
- array2 (Required): The second set of data values
Important Requirements:
- Both arrays must have the same number of data points
- Arrays should contain numeric values
- Empty cells, text values, and logical values are ignored
- If arrays contain different numbers of data points, Excel returns a #N/A error
Basic CORREL Function Examples
Example 1: Simple Correlation Analysis
Let’s calculate the correlation between temperature and ice cream sales:
| Temperature (°F) | Ice Cream Sales ($) |
|---|---|
| 75 | 120 |
| 80 | 140 |
| 85 | 160 |
| 90 | 180 |
| 95 | 200 |
Formula: =CORREL(A2:A6, B2:B6)
Result: 1.00 (Perfect positive correlation)
Example 2: Marketing Campaign Analysis
Analyze the relationship between advertising spend and website traffic:
=CORREL(C2:C10, D2:D10)
Where C2:C10 contains advertising spend data and D2:D10 contains corresponding website traffic numbers.
Advanced CORREL Function Techniques
Using CORREL with Named Ranges
Create named ranges for better formula readability:
- Select your data range
- Go to Formulas → Define Name
- Create names like “Sales_Data” and “Marketing_Spend”
- Use:
=CORREL(Sales_Data, Marketing_Spend)
Dynamic CORREL with OFFSET Function
Create dynamic correlations that automatically adjust as you add data:
=CORREL(OFFSET(A2,0,0,COUNTA(A:A)-1,1), OFFSET(B2,0,0,COUNTA(B:B)-1,1))
Interpreting Correlation Coefficient Results
Correlation Strength Guidelines
| Correlation Value | Relationship Strength | Interpretation |
|---|---|---|
| 0.9 to 1.0 | Very Strong Positive | Variables move together very closely |
| 0.7 to 0.9 | Strong Positive | Strong upward linear relationship |
| 0.3 to 0.7 | Moderate Positive | Moderate upward linear relationship |
| 0.0 to 0.3 | Weak Positive | Weak upward linear relationship |
| 0.0 | No Correlation | No linear relationship |
| -0.3 to 0.0 | Weak Negative | Weak downward linear relationship |
| -0.7 to -0.3 | Moderate Negative | Moderate downward linear relationship |
| -0.9 to -0.7 | Strong Negative | Strong downward linear relationship |
| -1.0 to -0.9 | Very Strong Negative | Variables move in opposite directions very closely |
Real-World CORREL Function Applications
1. Financial Analysis
Calculate correlation between stock prices and market indices:
=CORREL(Stock_Prices, Market_Index)
This helps in portfolio diversification and risk assessment.
2. Sales Performance Analysis
Determine the relationship between sales training hours and performance:
=CORREL(Training_Hours, Sales_Performance)
3. Quality Control
Analyze the correlation between production temperature and defect rates:
=CORREL(Temperature_Data, Defect_Rates)
Common CORREL Function Errors and Solutions
#N/A Error
Cause: Arrays have different sizes or contain no numeric data
Solution: Ensure both arrays have equal data points and contain numeric values
#DIV/0! Error
Cause: One or both arrays have zero variance (all values are identical)
Solution: Check data for constant values and ensure variability exists
#NUM! Error
Cause: Arrays are empty or contain insufficient data points
Solution: Verify arrays contain at least two data points each
CORREL vs. PEARSON Function
Excel also offers the PEARSON function, which is functionally identical to CORREL:
- CORREL: Traditional correlation function
- PEARSON: Named after Karl Pearson, same calculation
- Both return identical results for the same data
Enhancing CORREL with Conditional Logic
Filtering Data Before Correlation
Use array formulas to calculate correlation on filtered data:
=CORREL(IF(C2:C100>0, A2:A100), IF(C2:C100>0, B2:B100))
This calculates correlation only for rows where column C is positive.
Creating Correlation Matrices
Build comprehensive correlation matrices for multiple variables:
| Sales | Marketing | Temperature | |
|---|---|---|---|
| Sales | 1.00 | =CORREL($B$2:$B$10,C$2:C$10) | =CORREL($B$2:$B$10,D$2:D$10) |
| Marketing | =CORREL($C$2:$C$10,B$2:B$10) | 1.00 | =CORREL($C$2:$C$10,D$2:D$10) |
| Temperature | =CORREL($D$2:$D$10,B$2:B$10) | =CORREL($D$2:$D$10,C$2:C$10) | 1.00 |
Best Practices for Using CORREL Function
Data Preparation
- Clean your data by removing outliers that might skew results
- Ensure data represents the same time periods
- Check for missing values and handle appropriately
- Verify data types are numeric
Statistical Considerations
- Correlation doesn’t imply causation
- Consider sample size for statistical significance
- Look for non-linear relationships that CORREL might miss
- Use scatter plots to visualize relationships
Combining CORREL with Other Excel Functions
CORREL with ROUND Function
Display cleaner correlation results:
=ROUND(CORREL(A2:A10, B2:B10), 3)
CORREL with IF Function
Create conditional correlation analysis:
=IF(CORREL(A2:A10, B2:B10)>0.7, "Strong Correlation", "Weak Correlation")
Automating Correlation Analysis
Using Data Analysis ToolPak
For comprehensive correlation analysis:
- Enable Data Analysis ToolPak in Excel Add-ins
- Go to Data → Data Analysis → Correlation
- Select your data range
- Choose output options
Troubleshooting CORREL Function Issues
Performance Optimization
- Avoid volatile functions in CORREL formulas
- Use static ranges instead of entire columns when possible
- Consider using helper columns for complex calculations
Accuracy Considerations
- Be aware of floating-point precision limitations
- Round results appropriately for presentation
- Validate results with alternative methods when critical
Conclusion
The Excel CORREL function is an invaluable tool for statistical analysis and data interpretation. By understanding its syntax, applications, and limitations, you can make informed decisions based on data relationships. Remember that correlation analysis is just one piece of the analytical puzzle – always consider the broader context of your data and combine correlation insights with domain expertise for the most effective results.
Whether you’re analyzing business metrics, conducting research, or exploring data patterns, the CORREL function provides the foundation for understanding how variables interact. Practice with different datasets and scenarios to build your confidence in using this powerful Excel function effectively.
Related Posts

Excel COVAR Function: Complete Guide to Covariance Calculation with Examples
What is the Excel COVAR Function? The Excel COVAR function calculates the covariance between two datasets, measuring how two variables...
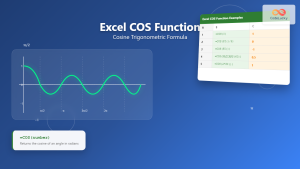
Excel COS Function: Complete Guide to Cosine Calculations and Trigonometric Formulas
What is the Excel COS Function? The Excel COS function is a built-in mathematical function that calculates the cosine of...

Excel SIN Function: Complete Guide to Sine Calculations in Spreadsheets
The Excel SIN function is a powerful mathematical tool that calculates the sine of an angle in radians. Whether you're...
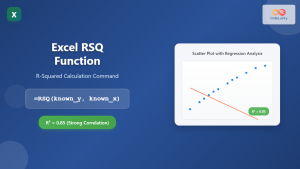
Excel RSQ Function: Complete Guide to R-Squared Calculations in Excel
What is the Excel RSQ Function? The RSQ function in Microsoft Excel calculates the square of the Pearson product-moment correlation...

Excel SLOPE Function: Complete Guide to Linear Regression Analysis
The Excel SLOPE function is a powerful statistical tool that calculates the slope of a linear regression line through a...

Excel SUM Function: Complete Guide to Addition Formulas and Advanced Techniques
The Excel SUM function is one of the most fundamental and widely-used formulas in Microsoft Excel, designed to add numerical...

Excel MIN Function: Complete Guide to Finding Minimum Values with Formula Examples
The MIN function in Microsoft Excel is one of the most fundamental and frequently used statistical functions for data analysis....

Excel SUMPRODUCT Function: Complete Guide to Array Multiplication and Advanced Calculations
What is the Excel SUMPRODUCT Function? The SUMPRODUCT function is one of Excel's most powerful and versatile array functions that...

Excel COUNT Function: Complete Guide to Number Counting Formulas
The COUNT function is one of Excel's most fundamental and frequently used statistical functions. Whether you're analyzing sales data, tracking...

Excel SIGN Function: Master Number Sign Detection with Practical Examples
The Excel SIGN function is a powerful mathematical tool that determines whether a number is positive, negative, or zero. This...

Excel SUMIF Function: Complete Guide to Conditional Sum Formulas with Syntax Examples
What is the Excel SUMIF Function? The SUMIF function is one of Excel's most powerful conditional sum formulas that allows...

Excel ACOS Function: Complete Guide to Arccosine Calculations
The Excel ACOS function is a powerful trigonometric tool that calculates the arccosine (inverse cosine) of a number, returning the...


