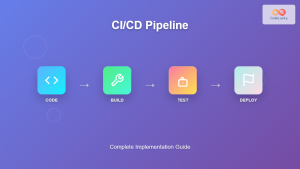
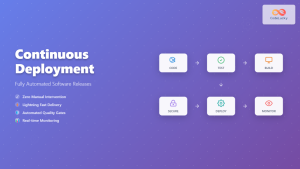
Welcome to the next installment in our “DevOps from Scratch” series! In our previous posts, we’ve explored the fundamentals of DevOps, Git workflows, Continuous Integration, and Continuous Deployment. Today, we’re diving into a crucial aspect of DevOps that often doesn’t get enough attention: metrics and optimization. We’ll explore how to measure the success of your DevOps initiatives and use those insights to drive continuous improvement.
The Importance of Metrics in DevOps
In the world of DevOps, the old adage “you can’t improve what you don’t measure” holds especially true. Metrics provide visibility into your development and operations processes, helping you identify bottlenecks, track progress, and make data-driven decisions. They’re essential for:
- Quantifying Improvement: Metrics allow you to set baselines and track progress over time.
- Identifying Bottlenecks: By measuring various aspects of your pipeline, you can pinpoint where slowdowns occur.
- Justifying Investments: Hard data helps in making the case for new tools or process changes.
- Aligning Teams: Shared metrics create a common language and goals across development and operations.
Key DevOps Metrics to Track
Let’s explore some of the most important metrics in DevOps and how to measure them:
1. Deployment Frequency
What it measures: How often you deploy code to production.
How to calculate: Count the number of deployments over a given time period (e.g., per day or week).
Why it matters: Higher deployment frequency usually indicates a more efficient, automated pipeline and a team comfortable with small, frequent changes.
Tool example:
from datetime import datetime, timedelta
import git

repo = git.Repo('/path/to/your/repo')
one_week_ago = datetime.now() - timedelta(days=7)

deploy_tags = [tag for tag in repo.tags if tag.name.startswith('deploy-') and tag.commit.committed_datetime > one_week_ago]

print(f"Deployments in the last week: {len(deploy_tags)}")
2. Lead Time for Changes
What it measures: The time it takes for a commit to get into production.
How to calculate: Measure the time from code commit to code successfully running in production.
Why it matters: Shorter lead times indicate a more efficient delivery process and the ability to respond quickly to business needs.
Tool example (using GitHub API):
import requests
from datetime import datetime

def get_lead_time(repo, commit_sha, deploy_time):
    commit_url = f"https://api.github.com/repos/{repo}/commits/{commit_sha}"
    response = requests.get(commit_url)
    commit_time = datetime.strptime(response.json()['commit']['author']['date'], "%Y-%m-%dT%H:%M:%SZ")
    return (deploy_time - commit_time).total_seconds() / 3600  # Convert to hours

# Usage
lead_time = get_lead_time("your-org/your-repo", "commit-sha", datetime.now())
print(f"Lead time: {lead_time} hours")
3. Change Failure Rate
What it measures: The percentage of deployments causing a failure in production.
How to calculate: (Number of deployments causing an incident / Total number of deployments) * 100
Why it matters: This metric helps gauge the stability and reliability of your deployment process.
Tool example (pseudocode):
def calculate_change_failure_rate(total_deployments, failed_deployments):
    return (failed_deployments / total_deployments) * 100

# Assuming you have a way to track these:
total_deployments = get_total_deployments_last_month()
failed_deployments = get_failed_deployments_last_month()

failure_rate = calculate_change_failure_rate(total_deployments, failed_deployments)
print(f"Change failure rate: {failure_rate}%")
4. Time to Restore Service
What it measures: How long it takes to recover from a failure in production.
How to calculate: Measure the time from when an incident is reported to when it’s resolved.
Why it matters: This metric is crucial for understanding your team’s ability to respond to and resolve issues quickly.
Tool example (using a hypothetical incident management API):
import requests
from datetime import datetime

def get_mttr(api_key, start_date, end_date):
    url = "https://your-incident-management-tool.com/api/incidents"
    headers = {"Authorization": f"Bearer {api_key}"}
    params = {"start_date": start_date, "end_date": end_date}

    response = requests.get(url, headers=headers, params=params)
    incidents = response.json()

    total_resolution_time = sum((inc['resolved_at'] - inc['created_at']).total_seconds() for inc in incidents)
    mttr = total_resolution_time / len(incidents) / 3600  # Convert to hours

    return mttr

mttr = get_mttr("your-api-key", "2023-01-01", "2023-12-31")
print(f"Mean Time to Restore: {mttr} hours")
Advanced DevOps Metrics
As your DevOps practice matures, consider tracking these advanced metrics:
5. Code Coverage
Measures the percentage of your code that is covered by automated tests.
6. Application Performance
Tracks response times, error rates, and resource utilization of your application in production.
7. Infrastructure as Code (IaC) Drift
Measures discrepancies between your defined infrastructure state and the actual state in production.
8. Security Vulnerabilities
Tracks the number and severity of security issues identified in your codebase and infrastructure.
Implementing a DevOps Metrics Dashboard
To make your metrics actionable, consider implementing a DevOps metrics dashboard. Here’s an example of how you might set this up using Grafana and Prometheus:
- Set up Prometheus to scrape metrics from your various systems (CI/CD tools, application servers, etc.).
- Configure Grafana to visualize the data from Prometheus.
- Create a dashboard with panels for each of your key metrics.
Here’s a sample Grafana dashboard configuration:
apiVersion: 1

providers:
  - name: 'DevOps Metrics'
    orgId: 1
    folder: ''
    type: file
    disableDeletion: false
    editable: true
    options:
      path: /var/lib/grafana/dashboards

dashboards:
  - name: 'DevOps Metrics Overview'
    uid: devops-metrics
    panels:
      - title: Deployment Frequency
        type: graph
        datasource: Prometheus
        targets:
          - expr: sum(increase(deployments_total[1w]))
      - title: Lead Time for Changes
        type: gauge
        datasource: Prometheus
        targets:
          - expr: avg(lead_time_seconds) / 3600
      - title: Change Failure Rate
        type: gauge
        datasource: Prometheus
        targets:
          - expr: sum(failed_deployments_total) / sum(deployments_total) * 100
      - title: Mean Time to Restore
        type: graph
        datasource: Prometheus
        targets:
          - expr: avg(incident_resolution_time_seconds) / 3600
Optimizing Your DevOps Processes
Once you have metrics in place, the next step is to use them to drive continuous improvement. Here are some strategies:
- Set Improvement Goals: Use your current metrics as a baseline and set realistic improvement targets.
- Conduct Regular Reviews: Hold meetings to review metrics and discuss improvement strategies.
- Implement Feedback Loops: Use post-mortem analyses after incidents to identify areas for improvement.
- Automate Relentlessly: Look for manual processes that can be automated to improve efficiency.
- Invest in Training: Continuously upskill your team to keep up with evolving best practices.
- Experiment with New Tools: Be open to trying new tools that might improve your metrics.
Case Study: DevOps Optimization in Action
Let’s look at a hypothetical case study of a company improving their DevOps processes:
Company X started with the following metrics:
- Deployment Frequency: 2 per month
- Lead Time for Changes: 2 weeks
- Change Failure Rate: 25%
- Mean Time to Restore: 4 hours
After implementing the following changes:
- Introducing feature flags for safer deployments
- Improving test automation to catch more issues before production
- Implementing automated rollback procedures
- Conducting regular “game day” exercises to practice incident response
After 6 months, their metrics improved to:
- Deployment Frequency: 3 per week
- Lead Time for Changes: 2 days
- Change Failure Rate: 10%
- Mean Time to Restore: 1 hour
This improvement led to faster feature delivery, higher quality releases, and more stable operations.
Conclusion: The Journey of Continuous Improvement
Measuring and optimizing your DevOps processes is not a one-time task, but a continuous journey. By consistently tracking key metrics and using that data to drive improvements, you can create a feedback loop that leads to ever-increasing efficiency, quality, and reliability in your software delivery process.
Remember, the goal isn’t to achieve perfect metrics, but to foster a culture of continuous improvement. Celebrate your successes, learn from your failures, and always be looking for the next opportunity to optimize.
In our next post, we’ll explore advanced DevOps patterns and anti-patterns, helping you avoid common pitfalls and adopt best practices that can take your DevOps implementation to the next level. Stay tuned!
We’d love to hear about your experiences with DevOps metrics and optimization! What metrics have you found most valuable? What strategies have you used to drive improvements? Share your stories and tips in the comments below!

