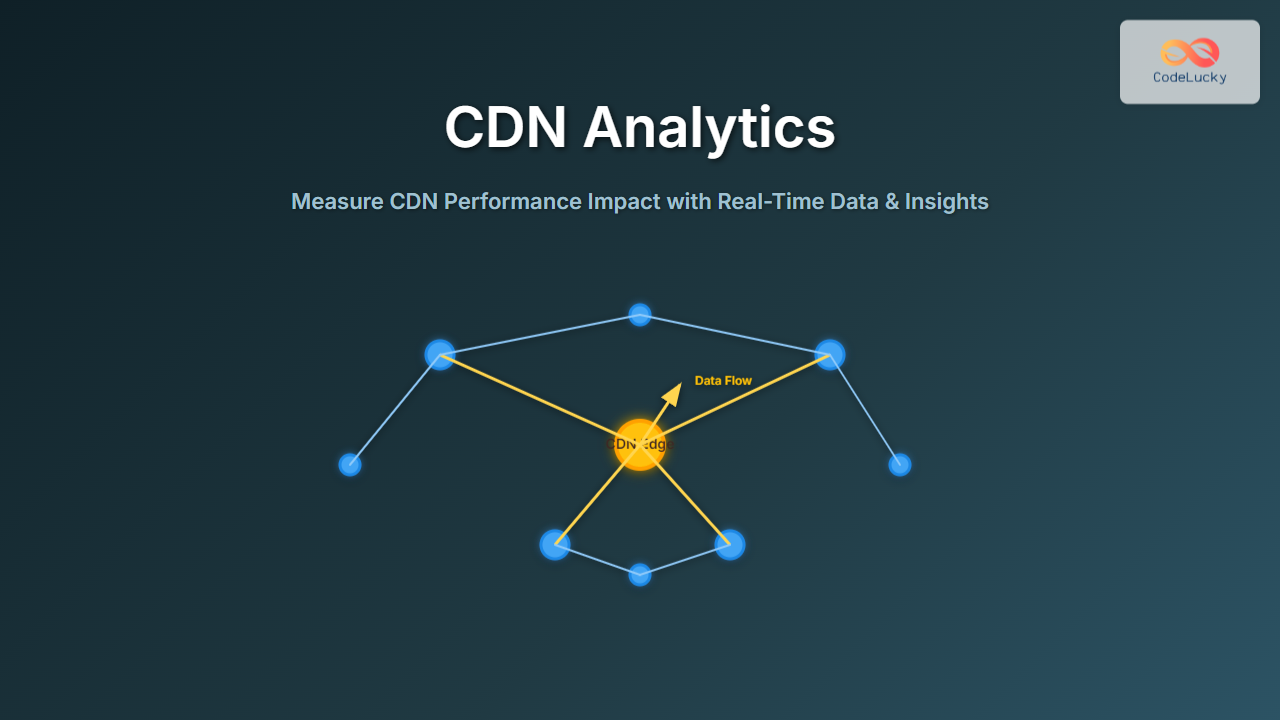
Content Delivery Networks (CDNs) have become indispensable for delivering digital content faster and more reliably worldwide. But how can developers and site owners quantify the real-world impact of a CDN on their web performance? CDN analytics is the key to unlocking data-driven insights that measure effects such as reduced latency, increased availability, and bandwidth savings.
In this comprehensive guide, we explore how to effectively measure and analyze CDN performance impact with practical methodologies, examples, visual diagrams, and interactive concepts designed for frontend developers, network engineers, and site operators interested in optimizing their web delivery.
What Is CDN Analytics?
CDN analytics refers to the collection, processing, and interpretation of performance data generated by a Content Delivery Network. It measures how well the CDN achieves three core goals:
- Latency reduction: Faster content delivery by caching resources closer to end users.
- Traffic offload: Reducing load on origin servers by serving cached content.
- Availability and reliability: Minimizing downtime or packet loss through geographically distributed nodes.
Analytics helps website owners identify strengths and bottlenecks in their CDN deployment.
Key Metrics to Measure CDN Impact
Measuring CDN performance requires understanding the essential metrics that reflect real user experience and infrastructure efficiency:
- Cache Hit Ratio (CHR): Percentage of user requests served directly by CDN cache versus going back to origin. Higher CHR means better CDN effectiveness.
- Time to First Byte (TTFB): Time taken for the browser to receive the first byte from the server or CDN edge node.
- Latency: Network delay between user and CDN edge server, influencing overall load speed.
- Bandwidth Savings: Amount of data served from CDN cache reducing origin traffic costs.
- Error Rate: Percentage of failed or misrouted requests, impacting availability.
How to Collect CDN Analytics Data
Modern CDN providers offer built-in analytics dashboards showing these metrics in real time or over historical periods. However, for deeper and customized insights, data can be gathered using:
- Logs Analysis: Extracting cache and delivery statistics from CDN logs (e.g., HTTP status codes, cache hits).
- Web Performance APIs: Using browser APIs like Navigation Timing, Resource Timing combined with user location to measure experience.
- Third-party Monitoring Tools: Synthetic testing and real user monitoring (RUM) platforms.
Example: Visualizing Cache Hit Ratio
Suppose an eCommerce site integrates CDN and tracks 10,000 page requests daily. The CDN analytics reports a cache hit ratio of 85%, meaning 8,500 requests are served from CDN cache and 1,500 go to the origin server.
This reduces load on origin infrastructure drastically and improves response time.
Cache Hit Ratio = (Cache Hits / Total Requests) * 100
For example: (8500 / 10000) * 100 = 85%
Visualizing this data can be done via a pie chart or in a dashboard showing relative load by origin vs CDN serving.
Interactive Performance Example Using Navigation Timing API
Developers can measure CDN impact dynamically by comparing TTFB with and without CDN routing using browser APIs.
// Sample JavaScript to log Time to First Byte (TTFB) using Navigation Timing API
window.addEventListener('load', () => {
  const [performanceEntry] = performance.getEntriesByType('navigation');
  const ttfb = performanceEntry.responseStart - performanceEntry.requestStart;
  console.log(`Time to First Byte: ${ttfb} ms`);
});
Running this on a page served through CDN edge nodes versus raw origin serves helps identify latency improvements from CDN adoption.
Advanced Analysis: CDN Latency Breakdown
This flow illustrates the latency components impacted by CDN. CDN optimizes by reducing DNS lookups, leveraging persistent connections, and serving cached content rapidly.
Using CDN Analytics to Optimize
Insights from CDN analytics empower teams to:
- Improve Cache Policies: Adjust TTLs and caching rules based on hit ratios and content update frequency.
- Identify Performance Bottlenecks: Pinpoint slow origins or edge locations needing remediation.
- Enhance Security: Analyze unusual traffic or error spikes indicative of attack vectors.
- Right-size Infrastructure: Scale origin servers intelligently by offloading traffic to CDN.
Conclusion
Measuring CDN performance impact through detailed analytics is a vital step for any organization harnessing CDN technology. Understanding metrics like cache hit ratios, TTFB, and latency allows for informed decisions that boost user experience, reduce server costs, and maintain resilient web services. Combining built-in CDN dashboards, browser APIs, and visual diagrams can help convey these insights effectively to technical and business stakeholders alike.


