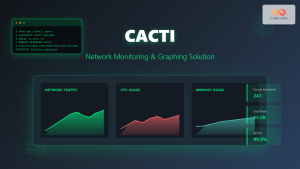
Cacti stands as one of the most powerful open-source network graphing solutions available for Linux systems, providing comprehensive network monitoring and visualization capabilities. This advanced guide explores how to leverage Cacti’s full potential for enterprise-level network graphing, monitoring, and performance analysis.
Understanding Cacti Architecture
Cacti operates as a complete network graphing solution built on several core components:
- RRDtool: Round Robin Database tool for data storage and graph generation
- MySQL/MariaDB: Database backend for configuration and metadata
- PHP: Web interface and data collection scripting
- SNMP: Simple Network Management Protocol for device communication
- Poller: Data collection engine that gathers metrics from monitored devices
Advanced Installation and Configuration
Installing Cacti on Enterprise Linux
For production environments, proper installation requires careful attention to dependencies and security:
# Update system packages
sudo dnf update -y

# Install required packages
sudo dnf install -y httpd mariadb-server php php-mysql php-snmp php-xml php-ldap php-mbstring php-gd php-gmp rrdtool net-snmp net-snmp-utils

# Enable and start services
sudo systemctl enable --now httpd mariadb

# Secure MariaDB installation
sudo mysql_secure_installation
Database Configuration
Create a dedicated database and user for Cacti with appropriate privileges:
# Connect to MariaDB
mysql -u root -p

# Create Cacti database and user
CREATE DATABASE cacti DEFAULT CHARACTER SET utf8 COLLATE utf8_general_ci;
CREATE USER 'cactiuser'@'localhost' IDENTIFIED BY 'strong_password_here';
GRANT ALL PRIVILEGES ON cacti.* TO 'cactiuser'@'localhost';
FLUSH PRIVILEGES;
EXIT;
Advanced PHP Configuration
Optimize PHP settings for Cacti performance in /etc/php.ini:
memory_limit = 512M
max_execution_time = 300
date.timezone = "America/New_York"
post_max_size = 16M
upload_max_filesize = 16M
Cacti Installation and Initial Setup
Downloading and Installing Cacti
# Download latest Cacti release
cd /tmp
wget https://www.cacti.net/downloads/cacti-latest.tar.gz
tar -xzf cacti-latest.tar.gz

# Move to web directory
sudo mv cacti-1.2.x /var/www/html/cacti
sudo chown -R apache:apache /var/www/html/cacti

# Create necessary directories
sudo mkdir -p /var/www/html/cacti/{log,rra}
sudo chown -R apache:apache /var/www/html/cacti/{log,rra}
sudo chmod 755 /var/www/html/cacti/{log,rra}
Database Schema Import
# Import Cacti database schema
mysql -u cactiuser -p cacti < /var/www/html/cacti/cacti.sql

# Set timezone tables for MySQL
mysql_tzinfo_to_sql /usr/share/zoneinfo | mysql -u root -p mysql
Advanced Configuration Techniques
Optimizing Data Collection
Configure the Cacti configuration file /var/www/html/cacti/include/config.php:
<?php
$database_type = 'mysql';
$database_default = 'cacti';
$database_hostname = 'localhost';
$database_username = 'cactiuser';
$database_password = 'strong_password_here';
$database_port = '3306';
$database_retries = 5;
$database_ssl = false;

/* Advanced Performance Settings */
$config['poller_id'] = 1;
$config['cacti_server_os'] = 'linux';
$config['cacti_web_root'] = '/var/www/html/cacti';
$config['url_path'] = '/cacti/';

/* RRD Configuration */
$config['rra_path'] = '/var/www/html/cacti/rra';
$config['log_path'] = '/var/www/html/cacti/log';
?>
Advanced Poller Configuration
For high-performance environments, configure spine (C-based poller) instead of the default PHP poller:
# Install spine dependencies
sudo dnf install -y gcc mysql-devel net-snmp-devel autoconf automake libtool dos2unix help2man

# Download and compile spine
cd /tmp
wget https://www.cacti.net/downloads/spine/cacti-spine-latest.tar.gz
tar -xzf cacti-spine-latest.tar.gz
cd spine-*
./configure --prefix=/usr/local/spine
make && sudo make install

# Configure spine
sudo cp /usr/local/spine/etc/spine.conf.dist /usr/local/spine/etc/spine.conf
sudo chown root:apache /usr/local/spine/etc/spine.conf
sudo chmod 640 /usr/local/spine/etc/spine.conf
Creating Custom Data Sources and Graphs
Advanced SNMP Data Collection
Configure custom SNMP data sources for specialized monitoring:
# Test SNMP connectivity
snmpwalk -v2c -c public 192.168.1.1 1.3.6.1.2.1.1.1.0

# Custom OID for interface traffic
# Interface In Octets: 1.3.6.1.2.1.2.2.1.10.2
# Interface Out Octets: 1.3.6.1.2.1.2.2.1.16.2
Custom Data Input Methods
Create script-based data collection for custom metrics:
#!/bin/bash
# /var/www/html/cacti/scripts/custom_cpu_usage.sh

# Get CPU usage percentage
CPU_USAGE=$(top -bn1 | grep "Cpu(s)" | awk '{print $2}' | awk -F'%' '{print $1}')
CPU_IDLE=$(top -bn1 | grep "Cpu(s)" | awk '{print $8}' | awk -F'%' '{print $1}')

echo "cpu_usage:$CPU_USAGE cpu_idle:$CPU_IDLE"
Advanced Templating and Automation
Creating Device Templates
Device templates streamline the monitoring setup for multiple similar devices:
- Navigate to Templates → Device Templates
- Create template with associated graphs:
- Interface Traffic
- CPU Utilization
- Memory Usage
- Disk Space
- Configure automatic graph creation rules
Graph Template Optimization
Advanced graph template configuration for professional visualizations:
# RRDtool command example for custom graph
rrdtool graph /tmp/traffic_graph.png \
--start -86400 \
--end now \
--width 600 \
--height 200 \
--title "Network Interface Traffic" \
--vertical-label "Bits per Second" \
DEF:inoctets=/var/www/html/cacti/rra/device_traffic_in.rrd:traffic_in:AVERAGE \
DEF:outoctets=/var/www/html/cacti/rra/device_traffic_out.rrd:traffic_out:AVERAGE \
CDEF:inbits=inoctets,8,* \
CDEF:outbits=outoctets,8,* \
LINE2:inbits#00CF00:"Inbound Traffic" \
LINE2:outbits#002A97:"Outbound Traffic"
Performance Optimization and Scaling
Database Optimization
Configure MySQL/MariaDB for optimal Cacti performance:
# /etc/my.cnf.d/cacti.cnf
[mysqld]
max_connections = 200
table_cache = 256
max_allowed_packet = 16M
join_buffer_size = 8M
tmp_table_size = 64M
max_heap_table_size = 64M
max_connections = 200

# InnoDB settings
innodb_buffer_pool_size = 1G
innodb_log_file_size = 64M
innodb_log_buffer_size = 8M
Cron Job Optimization
Configure efficient polling intervals:
# Add to crontab (crontab -e)
*/5 * * * * /usr/bin/php /var/www/html/cacti/poller.php > /dev/null 2>&1
*/1 * * * * /usr/bin/php /var/www/html/cacti/cmd.php > /dev/null 2>&1

# For high-frequency polling (1-minute intervals)
* * * * * /usr/local/spine/bin/spine > /dev/null 2>&1
Advanced Monitoring Scenarios
Network Device Monitoring
Monitor enterprise network equipment with detailed metrics:
- Router/Switch Performance: Interface utilization, error rates, packet loss
- Wireless Access Points: Client connections, signal strength, throughput
- Firewalls: Connection counts, rule hits, resource utilization
- Load Balancers: Server health, connection distribution, response times
Server Infrastructure Monitoring
# Example: Linux server monitoring script
#!/bin/bash
# /var/www/html/cacti/scripts/linux_advanced_stats.sh

# Memory usage
MEM_TOTAL=$(free -m | awk 'NR==2{printf "%.0f", $2}')
MEM_USED=$(free -m | awk 'NR==2{printf "%.0f", $3}')
MEM_FREE=$(free -m | awk 'NR==2{printf "%.0f", $4}')

# CPU load
LOAD_1MIN=$(uptime | awk -F'load average:' '{print $2}' | awk -F',' '{print $1}' | tr -d ' ')
LOAD_5MIN=$(uptime | awk -F'load average:' '{print $2}' | awk -F',' '{print $2}' | tr -d ' ')

# Disk usage
DISK_USED=$(df -h / | awk 'NR==2{print $5}' | sed 's/%//')

echo "mem_total:$MEM_TOTAL mem_used:$MEM_USED mem_free:$MEM_FREE load_1min:$LOAD_1MIN load_5min:$LOAD_5MIN disk_used:$DISK_USED"
Security and Authentication
LDAP Integration
Configure LDAP authentication for enterprise environments:
- Navigate to Configuration → Authentication
- Select LDAP Authentication
- Configure LDAP server settings:
- Server: ldap://your-domain-controller.com
- Port: 389 (or 636 for LDAPS)
- Base DN: DC=company,DC=com
- Bind DN: CN=service-account,OU=Service Accounts,DC=company,DC=com
SSL/TLS Configuration
Secure Cacti web interface with SSL:
# /etc/httpd/conf.d/cacti-ssl.conf
<VirtualHost *:443>
    ServerName cacti.company.com
    DocumentRoot /var/www/html/cacti

    SSLEngine on
    SSLCertificateFile /etc/ssl/certs/cacti.crt
    SSLCertificateKeyFile /etc/ssl/private/cacti.key

    <Directory "/var/www/html/cacti">
        AllowOverride All
        Options -Indexes
        Require all granted
    </Directory>

    <Directory "/var/www/html/cacti/install">
        Require all denied
    </Directory>
</VirtualHost>
Troubleshooting and Maintenance
Common Issues and Solutions
Poller Performance Issues:
# Check poller performance
tail -f /var/www/html/cacti/log/cacti.log

# Identify slow polling devices
grep "WARNING" /var/www/html/cacti/log/cacti.log | grep "took"
RRD File Corruption:
# Check RRD file integrity
rrdtool info /var/www/html/cacti/rra/device_traffic_1.rrd

# Recover corrupted RRD files
rrdtool dump /var/www/html/cacti/rra/device_traffic_1.rrd > backup.xml
rrdtool restore backup.xml /var/www/html/cacti/rra/device_traffic_1_new.rrd
Performance Monitoring
Monitor Cacti’s own performance:
# Database query performance
mysql -u cactiuser -p -e "SHOW PROCESSLIST;" cacti

# Check polling statistics
grep "STATS" /var/www/html/cacti/log/cacti.log | tail -20

# Memory usage monitoring
ps aux | grep -E "(httpd|spine|php)" | awk '{sum+=$6} END {print "Total Memory (KB): " sum}'
Advanced Reporting and Alerting
Custom Report Generation
Generate automated reports using Cacti’s API:
#!/usr/bin/php
<?php
// Cacti API report generation script
include_once('/var/www/html/cacti/include/global.php');

$devices = db_fetch_assoc("SELECT * FROM host WHERE disabled = ''");

foreach ($devices as $device) {
    $graphs = db_fetch_assoc("SELECT * FROM graph_local WHERE host_id = " . $device['id']);

    echo "Device: " . $device['description'] . "\n";
    echo "Status: " . ($device['status'] == 3 ? 'Up' : 'Down') . "\n";
    echo "Graphs: " . count($graphs) . "\n\n";
}
?>
Threshold-Based Alerting
Configure automatic alerting based on thresholds:
- Install THold Plugin
- Configure threshold templates
- Set up email notifications
- Create escalation procedures
Best Practices and Optimization
Capacity Planning
- Device Scaling: Plan for 1 GB RAM per 500 devices
- Polling Frequency: Balance data granularity with system load
- Data Retention: Configure appropriate RRA settings for storage optimization
- Network Bandwidth: Consider SNMP polling impact on network utilization
Maintenance Procedures
# Weekly maintenance script
#!/bin/bash
# /opt/cacti/maintenance.sh

# Backup database
mysqldump -u cactiuser -p cacti > /backup/cacti_$(date +%Y%m%d).sql

# Clean old log files
find /var/www/html/cacti/log -name "*.log.*" -mtime +30 -delete

# Optimize database tables
mysql -u cactiuser -p -e "OPTIMIZE TABLE poller_output, poller_time;" cacti

# Check RRD file permissions
find /var/www/html/cacti/rra -name "*.rrd" ! -user apache -exec chown apache:apache {} \;

echo "Maintenance completed: $(date)"
Conclusion
Cacti provides enterprise-grade network monitoring capabilities when properly configured and optimized. This advanced guide covers the essential aspects of deploying, configuring, and maintaining a robust Cacti installation on Linux systems. Regular monitoring of performance metrics, proactive maintenance, and proper security configuration ensure reliable long-term operation for comprehensive network visibility and management.
By implementing these advanced techniques, administrators can leverage Cacti’s full potential for sophisticated network monitoring, custom data visualization, and automated alerting in enterprise environments.
Related Posts
Cacti Linux: Complete Network Monitoring and Graphing Solution
Cacti is a comprehensive network graphing solution designed to harness the power of RRDtool's data storage and graphing functionality. Built...
Munin Linux: Complete Guide to Network Resource Monitoring and Performance Analysis
Munin is a powerful networked resource monitoring tool for Linux systems that provides comprehensive insights into system performance, resource utilization,...
observium Linux: Complete Network Management and Monitoring Platform Guide
Observium is a powerful, auto-discovering network monitoring platform designed for Linux systems that provides comprehensive visibility into network infrastructure. This...
SolarWinds Linux: Complete Network Performance Monitor Guide for System Administrators
SolarWinds Network Performance Monitor (NPM) is a powerful network monitoring solution that provides comprehensive visibility into network infrastructure performance. While...
LibreNMS Linux: Complete Network Monitoring System Setup and Configuration Guide
LibreNMS is a powerful, open-source network monitoring platform that provides comprehensive visibility into network infrastructure. Built on PHP and MySQL,...
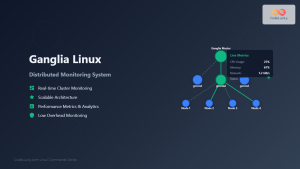
ganglia Linux: Complete Guide to Distributed Monitoring System
Ganglia is a powerful, open-source distributed monitoring system designed specifically for high-performance computing clusters, grids, and cloud infrastructures. Originally developed...
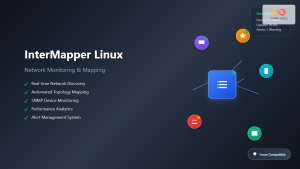
intermapper Linux: Complete Network Monitoring and Mapping Guide
What is InterMapper for Linux? InterMapper is a powerful network monitoring and mapping tool that provides real-time visibility into network...

iptraf Command Linux: Complete Interactive Network Monitoring Guide
The iptraf command is a powerful console-based network monitoring utility for Linux systems that provides real-time IP LAN monitoring capabilities....
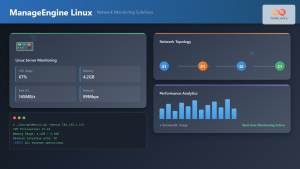
ManageEngine Linux: Complete Network Monitoring Solutions Guide
Network monitoring is crucial for maintaining optimal performance and security in Linux environments. ManageEngine provides powerful network monitoring solutions specifically...
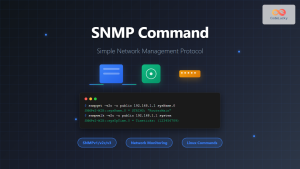
SNMP Command Linux: Complete Guide to Simple Network Management Protocol Configuration and Usage
Introduction to SNMP Command in Linux Simple Network Management Protocol (SNMP) is a fundamental protocol used for monitoring and managing...
Paessler Linux: Complete Guide to Network Monitoring with PRTG on Linux Systems
Network monitoring is crucial for maintaining optimal performance and security in Linux environments. Paessler PRTG Network Monitor offers comprehensive monitoring...
nagiosxi Linux: Complete Enterprise Network Monitoring Guide with Commands and Configuration
NagiosXI represents the pinnacle of enterprise network monitoring solutions on Linux systems, offering comprehensive infrastructure oversight with advanced alerting, reporting,...