Beats are lightweight, open-source data shippers developed by Elastic that collect different types of data from your systems and forward them to Elasticsearch or Logstash. These specialized agents run as services on Linux systems, providing real-time data collection with minimal resource overhead.
What Are Beats?
Beats serve as the data collection layer in the Elastic Stack, designed to be lightweight alternatives to traditional logging agents. Each Beat is purpose-built for specific data types, making them highly efficient for targeted data collection scenarios.
Key Benefits of Using Beats
- Lightweight footprint: Minimal CPU and memory usage
- Easy deployment: Single binary with simple configuration
- Reliable data shipping: Built-in retry mechanisms and acknowledgments
- Secure transmission: TLS encryption and authentication support
- Flexible output: Send to Elasticsearch, Logstash, or other outputs
Types of Beats
1. Filebeat – Log File Shipping
Filebeat monitors log files and directories, tailing files and shipping log data to your chosen destination.
Installation on Linux
# Download and install Filebeat (Ubuntu/Debian)
curl -L -O https://artifacts.elastic.co/downloads/beats/filebeat/filebeat-8.10.0-amd64.deb
sudo dpkg -i filebeat-8.10.0-amd64.deb

# For CentOS/RHEL
curl -L -O https://artifacts.elastic.co/downloads/beats/filebeat/filebeat-8.10.0-x86_64.rpm
sudo rpm -vi filebeat-8.10.0-x86_64.rpm
Basic Configuration
Edit the configuration file /etc/filebeat/filebeat.yml:
filebeat.inputs:
- type: log
  enabled: true
  paths:
    - /var/log/*.log
    - /var/log/apache2/*.log
  fields:
    logtype: system
  fields_under_root: true

output.elasticsearch:
  hosts: ["localhost:9200"]
  username: "elastic"
  password: "your-password"

processors:
  - add_host_metadata:
      when.not.contains.tags: forwarded
Starting Filebeat
# Enable and start the service
sudo systemctl enable filebeat
sudo systemctl start filebeat

# Check status
sudo systemctl status filebeat
Expected Output
● filebeat.service - Filebeat sends log files to Logstash or directly to Elasticsearch
Loaded: loaded (/lib/systemd/system/filebeat.service; enabled)
Active: active (running) since Tue 2025-08-26 09:34:15 IST; 2min ago
Docs: https://www.elastic.co/products/beats/filebeat
Main PID: 12345 (filebeat)
CGroup: /system.slice/filebeat.service
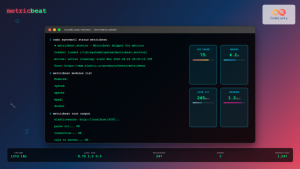
└─12345 /usr/share/filebeat/bin/filebeat -environment systemd2. Metricbeat – System and Service Metrics
Metricbeat collects metrics from the operating system and services running on your Linux systems.
Installation
# Ubuntu/Debian
curl -L -O https://artifacts.elastic.co/downloads/beats/metricbeat/metricbeat-8.10.0-amd64.deb
sudo dpkg -i metricbeat-8.10.0-amd64.deb
Configuration Example
metricbeat.config.modules:
  path: ${path.config}/modules.d/*.yml
  reload.enabled: true

metricbeat.modules:
- module: system
  metricsets:
    - cpu
    - load
    - memory
    - network
    - process
    - process_summary
    - socket_summary
  enabled: true
  period: 10s
  processes: ['.*']

- module: docker
  metricsets:
    - container
    - cpu
    - diskio
    - memory
    - network
  hosts: ["unix:///var/run/docker.sock"]
  period: 10s
  enabled: true

output.elasticsearch:
  hosts: ["localhost:9200"]
Enable Specific Modules
# List available modules
sudo metricbeat modules list

# Enable specific modules
sudo metricbeat modules enable system docker nginx

# Disable modules
sudo metricbeat modules disable apache
3. Packetbeat – Network Traffic Analysis
Packetbeat captures network traffic between application servers, providing insights into application performance and user behavior.
Installation and Setup
# Install Packetbeat
curl -L -O https://artifacts.elastic.co/downloads/beats/packetbeat/packetbeat-8.10.0-amd64.deb
sudo dpkg -i packetbeat-8.10.0-amd64.deb
Configuration
packetbeat.interfaces.device: any

packetbeat.protocols:
  http:
    ports: [80, 8080, 8000, 5000, 8002]
    hide_keywords: ["pass", "password", "passwd"]

  mysql:
    ports: [3306]

  redis:
    ports: [6379]

packetbeat.flows:
  timeout: 30s
  period: 10s

output.elasticsearch:
  hosts: ["localhost:9200"]
4. Heartbeat – Uptime Monitoring
Heartbeat monitors services for their availability with active probing.
Configuration Example
heartbeat.monitors:
- type: http
  schedule: '@every 10s'
  urls: ["http://localhost:9200"]
  check.response.status: 200

- type: tcp
  schedule: '@every 5s'
  hosts: ["localhost:9200"]

- type: icmp
  schedule: '@every 5s'
  hosts: ["8.8.8.8"]

output.elasticsearch:
  hosts: ["localhost:9200"]
Advanced Configuration Techniques
Multi-line Log Processing
Configure Filebeat to handle multi-line log entries like Java stack traces:
filebeat.inputs:
- type: log
  paths:
    - /var/log/app/*.log
  multiline.pattern: '^\d{4}-\d{2}-\d{2}'
  multiline.negate: true
  multiline.match: after
  multiline.max_lines: 500
Field Processing and Enrichment
processors:
  - add_host_metadata:
      when.not.contains.tags: forwarded

  - add_docker_metadata: ~

  - drop_fields:
      fields: ["beat", "input", "source"]

  - rename:
      fields:
        - from: "message"
          to: "log_message"
Custom Fields and Tags
fields:
  environment: production
  service: web-server
  team: backend

tags: ["production", "web", "frontend"]

fields_under_root: true
Security Configuration
TLS/SSL Setup
output.elasticsearch:
  hosts: ["https://elasticsearch.example.com:9200"]
  username: "beats_writer"
  password: "secure_password"
  ssl.certificate_authorities: ["/path/to/ca.crt"]
  ssl.certificate: "/path/to/client.crt"
  ssl.key: "/path/to/client.key"
API Key Authentication
output.elasticsearch:
  hosts: ["localhost:9200"]
  api_key: "VuaCfGcBCdbkQm-e5aOx:ui2lp2axTNmsyakw9tvNnw"
Performance Optimization
Tuning Harvester Limits
filebeat.inputs:
- type: log
  paths:
    - /var/log/*.log
  harvester_limit: 100
  close_inactive: 5m
  close_renamed: true
  close_removed: true
Output Buffering
output.elasticsearch:
  hosts: ["localhost:9200"]
  bulk_max_size: 3200
  worker: 2
  compression_level: 3
  template.settings:
    index.number_of_shards: 1
    index.number_of_replicas: 0
Monitoring and Troubleshooting
Checking Beat Status
# View real-time logs
sudo journalctl -fu filebeat

# Check configuration syntax
sudo filebeat test config

# Test output connectivity
sudo filebeat test output
Registry and State Management
# View Filebeat registry
sudo cat /var/lib/filebeat/registry/filebeat/log.json

# Clean registry (stop service first)
sudo systemctl stop filebeat
sudo rm -rf /var/lib/filebeat/registry/filebeat/
sudo systemctl start filebeat
Debug Mode
# Run in debug mode
sudo filebeat -e -d "publish,harvester"

# Specific module debugging
sudo metricbeat -e -d "module"
Integration with Kibana Dashboards
Loading Default Dashboards
# Setup Kibana dashboards for Filebeat
sudo filebeat setup --dashboards

# For Metricbeat
sudo metricbeat setup --dashboards

# Setup index templates
sudo filebeat setup --index-management
Custom Index Templates
setup.template.name: "custom-logs"
setup.template.pattern: "custom-logs-*"
setup.template.settings:
  index.number_of_shards: 1
  index.number_of_replicas: 1
  index.refresh_interval: 30s
Best Practices
Resource Management
- Monitor resource usage: Use
toporhtopto monitor Beat processes - Log rotation: Configure proper log rotation for Beat logs
- Disk space: Monitor registry and queue disk usage
High Availability Setup
output.elasticsearch:
  hosts: ["es1.example.com:9200", "es2.example.com:9200", "es3.example.com:9200"]
  loadbalance: true
  worker: 2
Data Retention
setup.ilm.enabled: true
setup.ilm.policy: "beats-default"
setup.ilm.rollover_alias: "filebeat"
setup.ilm.pattern: "{now/d}-000001"
Common Use Cases
Web Server Log Analysis
filebeat.inputs:
- type: log
  paths:
    - /var/log/nginx/access.log
  fields:
    logtype: nginx_access
    service: web

- type: log
  paths:
    - /var/log/nginx/error.log
  fields:
    logtype: nginx_error
    service: web
Application Performance Monitoring
metricbeat.modules:
- module: apache
  metricsets: ["status"]
  period: 10s
  hosts: ["http://127.0.0.1/server-status?auto"]

- module: mysql
  metricsets: ["status"]
  period: 10s
  hosts: ["tcp(127.0.0.1:3306)/"]
  username: metricbeat
  password: secret
Conclusion
Beats provide a comprehensive, lightweight solution for data collection on Linux systems. By implementing the configurations and best practices outlined in this guide, you can establish a robust data pipeline that efficiently collects logs, metrics, and network data for analysis in Elasticsearch.
Remember to regularly update your Beats installations, monitor their performance, and adjust configurations based on your specific requirements. The flexibility of Beats allows you to scale from simple single-server deployments to complex multi-datacenter environments while maintaining reliability and performance.
Related Posts
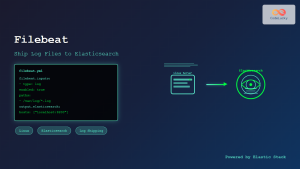
filebeat Linux: Complete Guide to Ship Log Files to Elasticsearch with Real Examples
Filebeat is a lightweight log shipper that belongs to the Elastic Stack (formerly ELK Stack) ecosystem. It's designed to monitor...
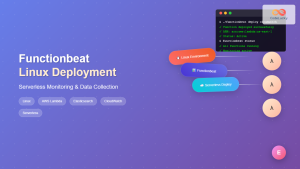
Functionbeat Linux: Complete Guide to Serverless Deployment and Monitoring
Functionbeat represents a revolutionary approach to serverless monitoring and data collection in modern cloud environments. As part of the Elastic...
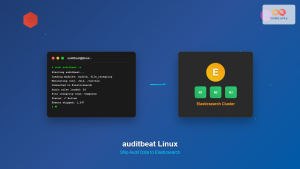
auditbeat Linux: Complete Guide to Shipping Audit Data to Elasticsearch
Introduction to auditbeat auditbeat is a lightweight shipper from the Elastic Beat family that collects audit data from the Linux...

elasticsearch Linux: Complete Guide to Search and Analytics Engine Installation and Usage
Elasticsearch is a powerful, distributed search and analytics engine built on Apache Lucene that enables real-time search, analysis, and visualization...
Winlogbeat Linux: Complete Guide to Shipping Windows Event Logs
Winlogbeat is a lightweight shipper designed to forward Windows Event Logs to Elasticsearch or Logstash. While it primarily runs on...
metricbeat Linux: Complete Guide to System and Service Metrics Monitoring
Metricbeat is a lightweight shipper that helps you monitor your systems and services by collecting metrics from the operating system...
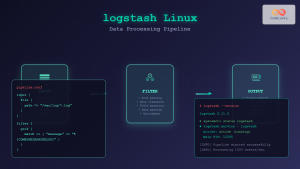
logstash Linux: Complete Guide to Data Processing Pipeline
What is Logstash? Logstash is a powerful, open-source data processing pipeline that ingests data from multiple sources simultaneously, transforms it,...
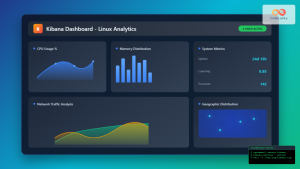
Kibana Linux: Complete Guide to Data Visualization Dashboard Setup and Management
Kibana is a powerful open-source data visualization and exploration tool that works seamlessly with Elasticsearch to provide interactive dashboards and...
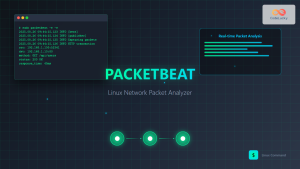
packetbeat Linux: Complete Network Packet Analysis Tool Guide
Network packet analysis is crucial for system administrators, security professionals, and developers who need to monitor, troubleshoot, and secure network...
Telegraf Linux: Complete Guide to Installing and Configuring the Metrics Collection Agent
Telegraf is a powerful, plugin-driven server agent for collecting and reporting metrics from databases, systems, and IoT sensors. As part...
Prometheus Linux: Complete Monitoring and Alerting Toolkit Guide
Prometheus has revolutionized the way we monitor and alert on modern infrastructure. As an open-source monitoring toolkit originally built at...
Marathon Linux: Complete Guide to Container Orchestration Platform
Marathon is a powerful container orchestration platform built on top of Apache Mesos that enables you to deploy, manage, and...